The Forex Chronicles

  • Rebates
  • Brokers
  • News
  • Analysis
  • Signals
    • Best Copy / Social Trading Platforms
    • eToro Review
    • FXTM Invest Review
    • Marketclub Review
    • ZuluTrade Review
  • Indicators
  • Strategies
  • Articles

Another Bitcoin Inside Bar Breakout For September 2018?

September 11, 2018 by James Woolley Leave a Comment

Previous Price Action

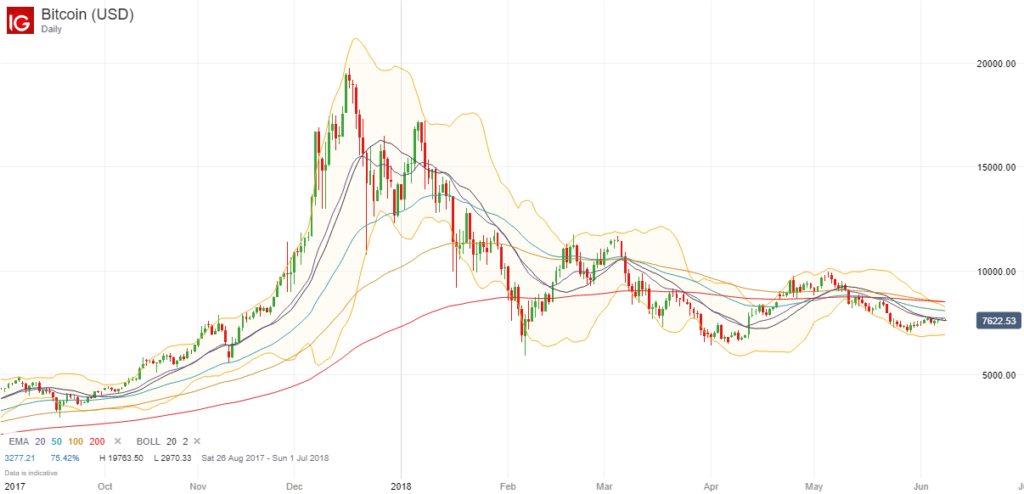
If you visit this site regularly, you will know from a previous post that there was a decent inside bar breakout that occurred on Bitcoin last month.

After trading in a sideways trading range for a considerable amount of time, there was an inside bar trading pattern whereby the price continued to trade within the range of the initial bar for several days, which reinforced my belief that it was only a matter of time before we saw a decent breakout, and that’s exactly what happened.

Bitcoin Inside Bar Breakout - August 2018

As I said previously, it wasn’t a perfect set-up because of the bearish breakout bar, but nevertheless you still could have generated up to 700 points profit by entering a long position at the closing price of the breakout candle.

Inside Bar Breakout Part II

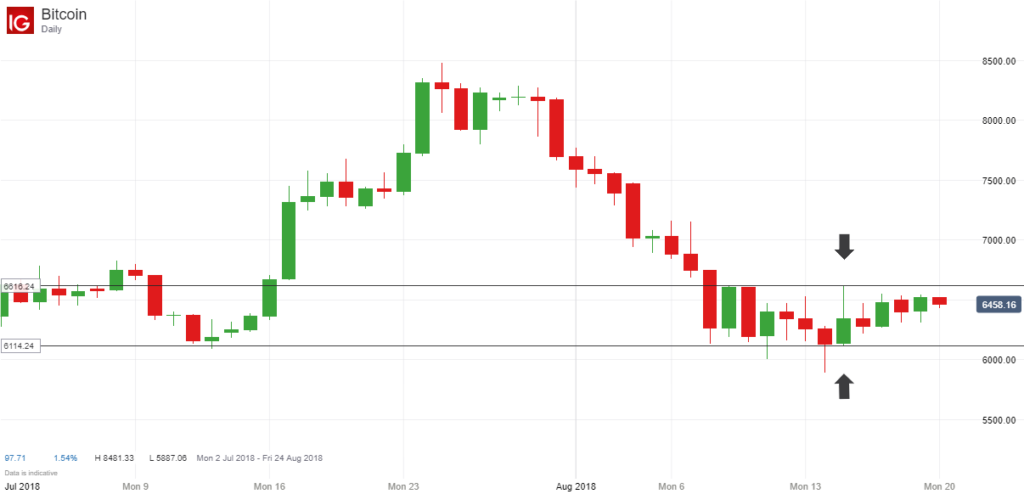
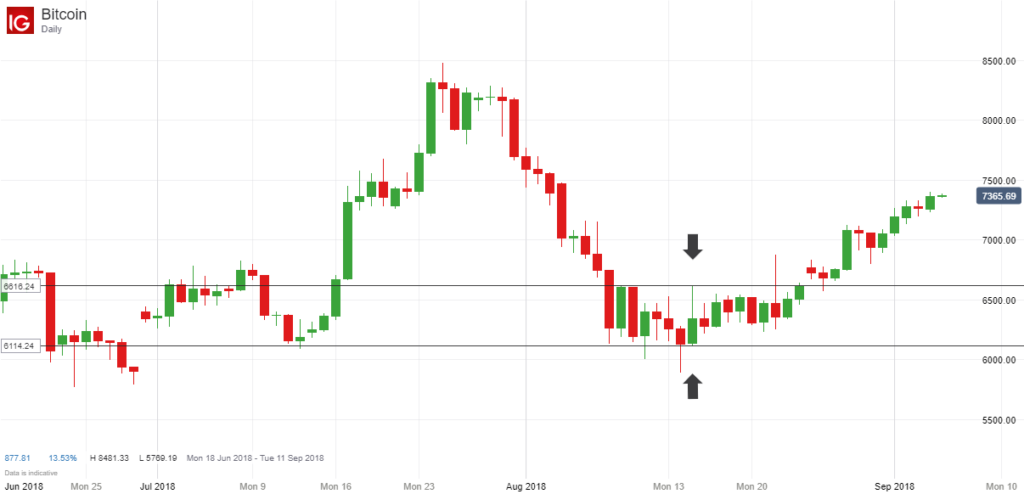
If you take a look at the right hand side of the chart below to view the very latest price action, you will notice that history appears to be repeating itself.

Bitcoin Inside Bar - September 2018

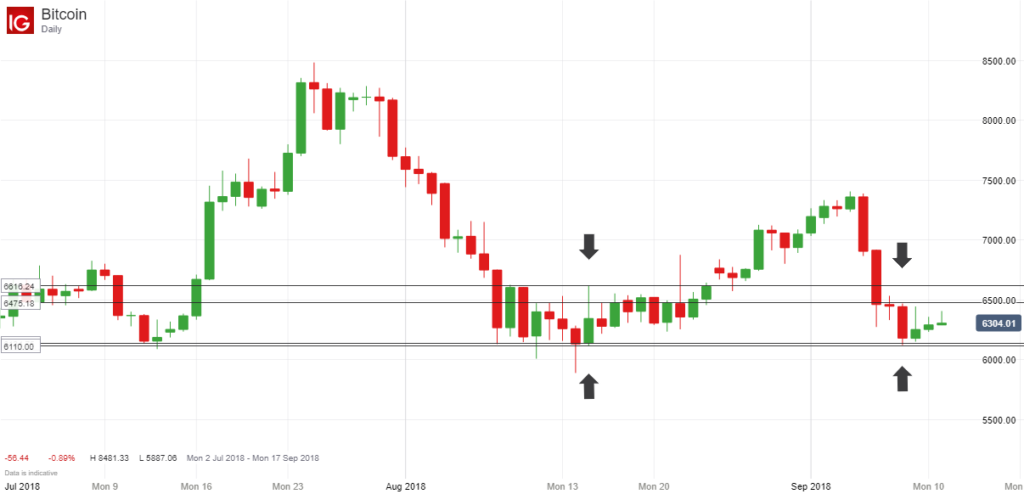
After surging upwards to a high of around $7400, the price of Bitcoin has since fallen sharply and is now trading within the range of the previous inside bar.

Furthermore, we now have a new inside bar set-up because at the time of writing, the price has been trading within the range of the initial bar for the last three days.

The set-up bars are indicated by the arrows in the chart above, and you can see that the following bars / candles are all inside bars, which is often a great set-up for a significant breakout.

Trading Opportunity

As a result of this, it may be worth watching the price of this popular cryptocurrency to see if there is a good opportunity to enter a new long or short position (depending on the direction of the breakout) in the coming days.

It may be profitable to simply enter a trade when the price breaks out of the range of the initial set-up bar (and closes outside of this range), but I personally would like to see the breakout bar close outside of the range of the previous inside bar trading range as well because I think this range still carries a lot of weight and is highly significant.

Anyway I just thought I would share with you this latest inside bar set-up because the subsequent breakouts that occur can be very profitable. As always, this is not a recommendation to trade, it is just my own personal thoughts and opinions. Please be aware that cryptocurrency trading is very risky, and there is the potential to lose a lot of money.

Filed Under: Analysis Tagged With: bitcoin, breakout, inside bar

Inside Bar Breakouts On GBP/JPY And Bitcoin From Last Month

September 5, 2018 by James Woolley Leave a Comment

Introduction

As I have mentioned previously on this site, inside bar breakouts are some of the my favorite trading patterns to trade because they will often yield some excellent profits.

This is particularly true when these inside bar breakouts come towards the end of a trend because they often provide solid confirmation that a reversal is taking place.

So with that in mind, I thought I would share you two profitable inside bar breakouts that occurred last month, ie August 2018, to give you an idea of how you can potentially trade these breakouts in the future.

Bitcoin Inside Bar Breakout

The first breakout is one that I have already discussed already in a previous blog post. On this occasion I actually discussed an inside bar breakout opportunity before it occurred, when I highlighted Bitcoin’s narrow trading range.

As you can see from the chart below, the price was trading sideways for long periods of time with no clear direction, with all the inside bar candles trading within the range of the initial bar.

Bitcoin Price Chart - August 2018

This is always a good set-up for a potential breakout, and this is what subsequently happened:

Bitcoin Inside Bar Breakout - August 2018

From a trading perspective, this wasn’t a perfect set-up because the breakout candle wasn’t exactly a decisive one. It is always a better signal when the price breaks strongly upwards or downwards out of its narrow trading range, but nevertheless this is one that would still have yielded decent profits of nearly 700 points so far if you had entered at the closing price of the first breakout candle.

GBP/JPY Inside Bar Breakout

Another decent set-up from last month occurred on the daily chart of the GBP/JPY pair. This pair had fallen sharply, along with many of the other GBP pairs, and during a period of consolidation, several inside bars had started to form.

Therefore when the price closed above the initial candle, this was a good opportunity to open a new long position and trade the breakout and the reversal.

GBPJPY Inside Bar Breakout - August 2018

As you can see from the chart above, this had a much stronger breakout candle and would also have yielded some decent returns. With the momentum gathered from the positive Brexit news that was starting to emerge, the price moved around 250 points higher from the closing price of the breakout candle, and although it has since dropped back a little, it could still go higher.

Final Thoughts

It is worth mentioning that these inside bar breakouts don’t occur that often across all of the major currency pairs, but when they do occur, they can be very profitable when you get the right set-up.

I would also add that I would feel more confident trading a major currency pair, such as the GBP/JPY pair, for example, rather than a cryptocurrency such as Bitcoin simply because they are completely unregulated and have large spreads, and no-one really knows what could happen in the future. They could easily rise or fall thousands of dollars in a single day, and subsequently destroy your capital if you are not careful.

Filed Under: Analysis Tagged With: bitcoin, breakout, gbpjpy, inside bar

Potential Inside Bar Breakout On Bitcoin For August 2018

August 20, 2018 by James Woolley Leave a Comment

Trading Bitcoin

After the European Securities and Markets Authority increased cryptocurrency margin rates to 50%, it has obviously become a lot more expensive to trade Bitcoin and other cryptocurrencies, and a lot less appealing.

The spreads can also be quite off-putting as well because even if your broker does offer Bitcoin trading, you may need the price to move 50-200 points (or more) just to break even.

Nevertheless those that do have enough capital in their trading accounts can still potentially benefit from some big price swings because this is still quite a volatile market to trade, and when the price does start moving, it can easily move upwards of 1000-2000 points in just a few days.

Inside Bar Breakout

Many people are sceptical about treating these cryptocurrencies the same as any other market, and using the same kind of technical analysis to find profitable trading opportunities, but based on previous price action, it does seem to be very profitable to trade any breakouts that occur.

That’s why I wanted to highlight the current price action because the price of Bitcoin has been trading in a sideways range just recently, and more significantly, the last 5 daily candles are all inside bars, ie the last 5 candles are all within the high and low of the large candle from 15 August (indicated by the arrows), which had a daily range of around 500 points.

Bitcoin Price Chart 20 August 2018

How To Trade

A lot of traders have their own personal inside bar and breakout strategies that they like to use, but I myself like to enter a new position when the price moves above the high or below the low of the initial candle and CLOSES above or below this candle.

In my experience, you don’t want the breakout candle to be too large, but you don’t really want the breakout candle to be one that has a small trading range either because this could be a false breakout.

Anyway I just wanted to share my thoughts on the latest Bitcoin trading action, and explain how I like to trade these breakouts when they occur.

Whether the price moves strongly higher or strongly lower after the price closes above the initial candle remains to be seen, but it will be interesting to watch what happens regardless because the price has barely moved in the last few weeks.

An upward breakout could see the price test its recent highs of around $8500, whilst a downward breakout could potentially see the price collapse if it breaches its recent low of $5887 from last week and its previous low of $5769 from June.

Please note I am not offering any advice or recommending any trades. You should always do your own research and make your own decisions before entering a position.

Filed Under: Analysis Tagged With: bitcoin, breakout, inside bar

Bitcoin Update – Now Over $8000

July 25, 2018 by James Woolley Leave a Comment

What Has Caused Bitcoin To Surge Higher?

If you have been watching the price of Bitcoin closely over recent months, you will know that it hasn’t really moved a great deal, and has predominantly been trading in a sideways trading pattern for a number of weeks.

However just when it appeared that people were starting to lose interest in Bitcoin and other cryptocurrencies, the price suddenly surged higher, going from just under $5800 to around $8300, suggesting that people are becoming more bullish about the future prospects of Bitcoin once again.

It is not immediately obvious why positive sentiment has returned, but this article from Fxstreet.com, suggests that it could be due to a number of factors, such as Google and Facebook easing the pressure on cryptocurrencies, calls for easier regulation, interest from institutions and a move towards a Bitcoin ETF.

How Could You Have Profited From This Price Swing?

From a trading point of view, not many people would have predicted that we would see such a strong move above $8000 in such a short space of time, but there were definitely opportunities to make money from this latest breakout.

That’s because as I pointed out in a recent blog post that discussed Bitcoin’s lack of volatility, it was trading in a sideways trading range for a long time. So you just needed to be patient and wait for the price to break upwards or downwards with momentum.

Indeed there were actually two opportunities to make money because the price broke downwards just days after my last post, falling 10% in one weekend. Therefore if you had entered a short position after this strong price move, or entered a short position after waiting for a small rebound, you could have made up to 1000 times your stake because the price of Bitcoin subsequently fell another $1000 in the following days and weeks.

With this latest move, the Bollinger Bands were very close together once again, as indeed were the EMAs that I like to use, which indicated a sideways trading range and hinted that a possible breakout was imminent in the future, and this subsequently occurred on 17 July when the price broke strongly out of this narrow range to close at $7315. This would have been a good point to enter a long position because the price has already moved around $1000 higher.

Bitcoin Price Chart - 25 July 2018

Closing Comments

Of course it is easy to be wise after the event, and it would be very easy to sit here and claim that I profited from both of these breakouts, but that wasn’t the case at all because I have never traded Bitcoin or any other cryptocurrencies.

Nevertheless, I have profited from similar breakouts on other markets, and just wanted to point out that these breakouts seem to be just as profitable on Bitcoin as they are on all these other markets.

In fact they are probably even more profitable because when the price of Bitcoin starts to rise or fall, it seems to gather momentum really quickly and will often move at least $1000 each time, and sometimes a lot more.

So it may be worth keeping an eye out for these profitable breakout opportunities in the future because when the price starts to trade in a very narrow trading range with tightly packed Bollinger Bands and exponential moving averages, it is often followed by a significant breakout either upwards or downwards.

Filed Under: News Tagged With: bitcoin, bitcoin chart, breakout

Bitcoin’s Lack Of Volatility Suggests A Breakout Could Be Imminent

June 8, 2018 by James Woolley Leave a Comment

Bitcoin’s Volatile Past

If you have ever purchased any Bitcoins, you will know that this particular cryptocurrency has been on a crazy ride so far.

Just 3 years ago today you could buy a single Bitcoin for just $222, which seemed really expensive at the time, but today it is worth a staggering $7620.

That’s only half the story as well because at one point Bitcoin experienced a surge in popularity as a result of widespread media exposure, and everyone seemed to be buying Bitcoin and jumping on the bandwagon.

This helped to push the price of Bitcoin to an all-time high of $19,783.06 as demand far outstripped supply, but it has since fallen by more than 60% from its highs.

So while many people will have made some huge life-changing gains, a lot of people who were late to the party are nursing some massive losses.

Lack of Volatility in Summer 2018

In the last month or so, the price of Bitcoin appears to have stabilized between 7000 and 8000, and is a lot less volatile than it used to be. The days of massive price swings appear to be over, at least for now.

This can be seen in the price chart below because you can see that the Bollinger Band indicator, which itself is a good indicator of volatility, is as narrow now as it has ever been, and all of the EMAs (exponential moving averages) that I like to use are all very close together, which also indicates a low volatility sideways trading range.

Bitcoin Price Chart 8 June 2018

Breakout Trading Opportunity?

It is extremely difficult to make money when an instrument is trading in a sideways trading range with no clear direction or momentum, but this is often the calm before the storm.

As soon as the price breaks out of one of these trading ranges with volume and momentum, it is often the start of a large breakout, either to the upside or downside, and therefore there is potentially a lot of money to be made by entering a position in the same direction as this breakout.

Of course there are no guarantees because you do sometimes see some false breakouts, but it will be interesting to watch the price of Bitcoin in the coming weeks.

If the price manages to move strongly upwards or downwards and smash through one of the outer Bollinger Bands, it could signal the start of a new trend, and therefore could represent a decent trading opportunity.

(Please note that this is just my own personal thoughts and ideas, and does not represent professional financial or trading advice in any way. You should always do your own research before trading Bitcoin or any other financial instrument.)

Filed Under: Analysis Tagged With: bitcoin, bitcoin chart, breakout

  • « Previous Page
  • 1
  • 2
  • 3

Forex Rebates:

Choose from 40+ different forex brokers and crypto exchanges, and get cashback every time you trade:


Copy Profitable Traders:

If you join ZuluTrade, you can follow and subscribe to profitable traders and all of their trades will be automatically copied in your own trading account.

You can also earn money as a signal provider if you are already a profitable trader.

Click here to find out more

Recommended Broker:

Recent Blog Posts:

  • High Probability Trade on S&P 500 – 26 January 2024
  • Oanda Moves Into Prop Trading With Labs Trader Program
  • My eToro Performance in 2023 – Up 33.24%
  • The5ers Offering $20K Bootcamp Challenge For Just $1
  • Example of VWAP Bounce Trade on S&P 500 – 18 December 2023

Recent Articles:

VWAP Indicator
  • MA Sabres (LuxAlgo) Indicator
  • 10 Harsh Truths About Forex Trading
  • Best Websites for Monitoring Currency Strengths
  • Xmaster Formula Indicator for MT4 and MT5
  • Tools:

    Currency Heat Map

    Categories

    • Analysis
    • News

    Archives

    • January 2024
    • December 2023
    • November 2023
    • October 2023
    • September 2023
    • August 2023
    • July 2023
    • June 2023
    • May 2023
    • August 2020
    • June 2020
    • May 2020
    • April 2020
    • January 2020
    • December 2019
    • November 2019
    • October 2019
    • September 2019
    • August 2019
    • July 2019
    • June 2019
    • May 2019
    • April 2019
    • March 2019
    • February 2019
    • January 2019
    • December 2018
    • November 2018
    • October 2018
    • September 2018
    • August 2018
    • July 2018
    • June 2018
    • May 2018
    • March 2016
    • December 2015
    • November 2015
    • October 2015
    • August 2015
    • July 2015

    Disclaimer

    This website should be used for general information purposes only and in no way represents professional financial advice.

    Forex and CFD trading carries a high level of risk and it is possible to lose more than your initial deposit if using leveraged products.

    Copyright © 2025 · eleven40 Pro Theme on Genesis Framework · WordPress · Log in

    • About
    • Contact
    • Disclosure
    • Privacy Policy
    • Terms Of Service