The Forex Chronicles

  • Rebates
  • Brokers
  • News
  • Analysis
  • Signals
    • Best Copy / Social Trading Platforms
    • eToro Review
    • FXTM Invest Review
    • Marketclub Review
    • ZuluTrade Review
  • Indicators
  • Strategies
  • Articles

Oil Update – 24 May 2020

May 24, 2020 by James Woolley Leave a Comment

Recent Breakout

At the start of this month, I highlighted the price breakout that had occurred on the daily chart of WTI Crude, and suggested that the price may well continue moving up towards the $30 level.

If you follow the oil markets, you probably already know the outcome, but in this article I thought I would provide a quick update to show you what has happened since that time.

This was how the price chart looked when I wrote my last blog post:

WTI Crude Breakout - 4 May 2020

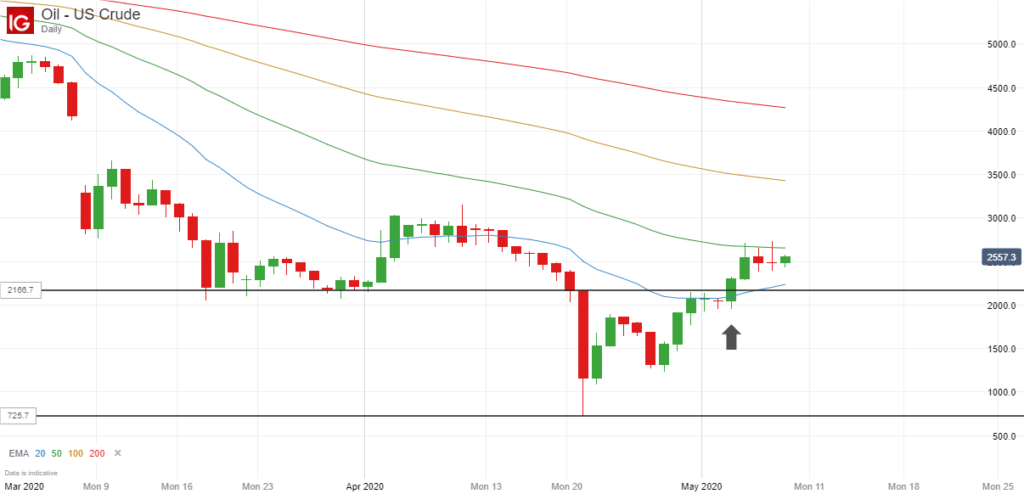
And this is how the price has moved since that original inside bar breakout:

Oil US Crude Daily Chart - 24 May 2020

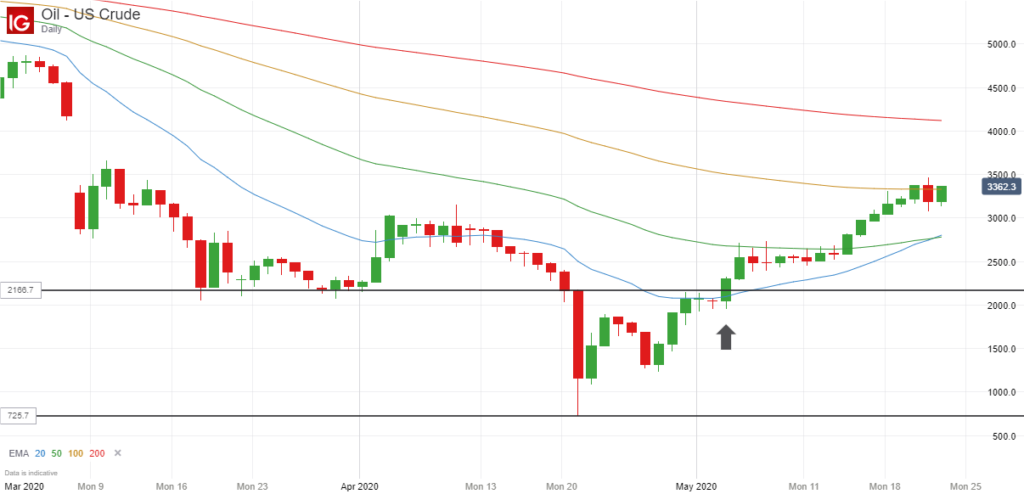
As you can see, this has turned out to be a very positive breakout trade for those who decided to take it because not only did the price move up to the $30 level, but it actually broke straight through this level, which would ordinarily provide some resistance because it’s a significant round number, and was trading above $34 a short while ago.

Inside Bar Breakout #2

If you didn’t manage to take this trade, the market provided you with a second opportunity to ride this upward trend because there was actually a second inside bar breakout that occurred shortly after the first one.

Oil Chart May 2020 Inside Bar Breakout 2

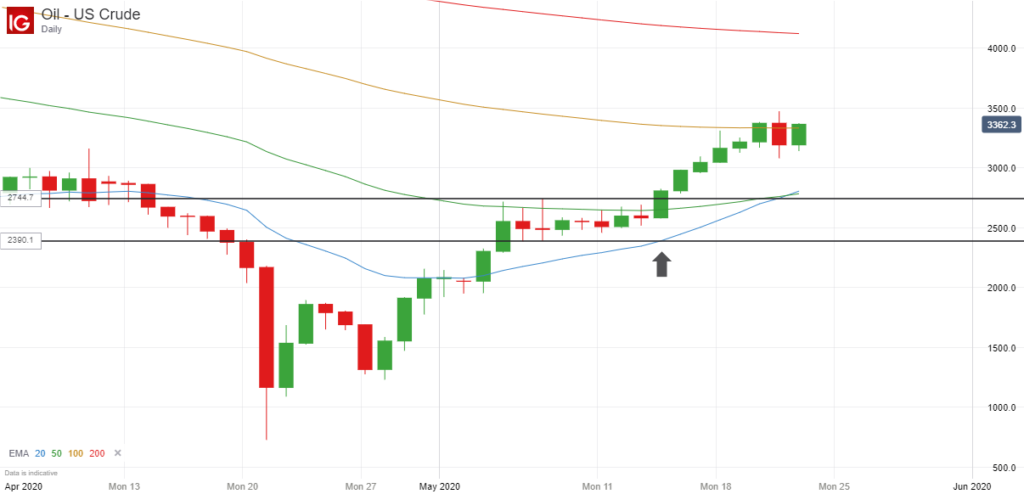
Zooming in to the recent price action, you can see that after the initial price breakout, there was a fairly large red candle followed by five consecutive inside bars where the price traded within the range of the initial set-up bar, indicated by the two lines.

This was basically telling you that there was a period of indecision after the initial breakout, but when the price broke above, and crucially closed above the upper line on 14 May, traders immediately jumped on board with new long positions and drove the price higher to its recent highs.

The breakout candle closed at around $28, so this would potentially have offered a gain of more than $6, or 20% for those people who traded this second inside bar breakout.

Closing Comments

The point of this article is not to brag about how I called this breakout correctly because I am definitely not in a position to do that. I am not an oil trader myself and didn’t actually take a position on it.

I just wanted to re-emphasise how effective inside bar breakouts can be, regardless of which markets you prefer to trade.

If you can find a price chart where you have a large set-up bar / candle and several consecutive bars / candles that all trade within the range of this initial bar, the odds of success are very high when the price does eventually break out of this narrow trading range.

This is particularly true on the longer time frames because if you take the daily chart, for example, 5-10 consecutive inside bars represents 1-2 weeks of consolidation and indecision, which is a long time in the trading world.

Therefore any resulting price breakout is likely to generate a lot of interest and will often have a lot of volume and momentum behind it when it eventually occurs.

Filed Under: Analysis Tagged With: breakout, inside bar, oil

Crude Oil Breakout From 4 May 2020

May 10, 2020 by James Woolley Leave a Comment

Price Action

If you have been watching the price of oil in recent weeks and months, you will know that it has been on a crazy ride just recently.

Indeed there was a brief time when the oil price actually went negative when the latest contract expired, which was an unprecedented event that has never happened before.

The price had already tumbled as a result of tensions between Saudi Arabia and Russia, followed by the sharp drop-off in demand caused by global lockdowns, but the constant shorting of oil pushed the spot price of WTI Crude Oil down to just $7 per barrel.

Breakout

As countries have started to reopen for business, the price of WTI Crude has started to slowly rise again, and in this article I want to highlight a breakout that occurred last week that you may have missed.

WTI Crude Breakout - 4 May 2020

Inside bar breakouts are some of the most profitable breakouts you can trade if you wait for the right set-ups, and this was a decent example of a high probability set-up.

As you can see, there was initially a large red candle on 21 April 2020, but for the next ten trading sessions, the price of WTI Crude actually stayed within the entire range of this candle. So in other words, there were ten consecutive inside bars.

When this happens, there is often a strong breakout when the price finally breaks out of the range of this inside bar (and closes outside it), and that’s exactly what happened here.

On 4 May 2020, the price broke upwards out of this range and closed at almost exactly $23.

This would have been a good point to enter a long position because the price then went up to $27.15 the following day, representing a potential gain of $4.15.

Since then the price has dropped back to around the $25 mark, but I think many traders are expecting the momentum of this breakout to continue, with the price heading up towards the $30 level at some point.

Final Thoughts

I didn’t actually take this trade myself because I don’t like to trade oil on eToro (my risk score is high enough already thanks to my BP and RDSB stock holdings), but I just wanted to highlight how profitable these inside bar breakouts can be.

Just having two consecutive inside bars can be enough to give you a strong breakout trading opportunity, but it is often the case that your odds of success increase even more when you have several of these inside bars within the range of the initial candle.

That’s why I wanted to demonstrate with this example because here we had ten inside bar candles in a row, thanks to the extraordinarily large set-up candle that spooked the markets and prompted so many headlines.

It’s interesting to note that if you go back to the price chart and look at the price action before this large drop-off, you will see that there was a downward inside bar breakout just prior to this as well.

This would have got you into a short position at around $26.60, just before the big fall of nearly $20, but we can all be wise after the event, and in reality, many traders would probably have banked their profits before the price collapsed from $22 to $7.

The point is that you want to keep an eye out for these inside bar set-ups. They work really well on the longer time frames in particular, and when they occur at a peak or a trough, the resulting breakouts can potentially be large enough to give you some good gains.

Filed Under: Analysis Tagged With: breakout, inside bar, oil

Potential Bitcoin Breakout – April 2020

April 20, 2020 by James Woolley Leave a Comment

Bitcoin Trading

Bitcoin has always been a popular instrument for long-term buy and hold investors because many people see the long-term value of this particular cryptocurrency, and believe that it will be trading a lot higher in the years to come.

However it has also become a very popular market for short and medium-term traders to trade because many people have found that it follows similar patterns as the more conventional trading instruments (stocks, indices, commodities, etc), and works really well with technical analysis.

So with that in mind, I want to offer my latest analysis of Bitcoin’s recent price action, and highlight why it may be set for a possible breakout in the near future.

Recent Price Action

As you can see from the price chart below, the price has been trading within a descending triangle for much of 2020.

Bitcoin Price Chart - April 2020

It reached a high of around $10,500 back in February, and posted a low of around $3900 on 13 March 2020, after losing approximately half its value in just two days of relentless selling.

Since hitting that low point, the price has been slowly trending upwards, trading just above $7000, and now seems to be somewhat stuck in a sideways trading range, undecided about which direction to take.

Possible Breakout

This indecisiveness, combined with the descending triangle pattern, suggests to me that we may be about to see a significant breakout once the price breaks decisively out of this triangle.

At the moment it is hard to see the price of Bitcoin breaking strongly upwards because if you look at a few other indicators, you can see that this upward price movement is starting to run out of momentum.

For example, there is divergence on both the MACD and MACD histogram indicators, and both are looking like they might be about to cross downwards, indicating the start of a new downward trend.

If the price were to break below the psychologically important 7000 level, and then close below the lower trendline of the descending triangle, ie below 6900, then it could easily fall back to the 6000 level in a short space of space, and possibly as low as 5000 over time if this breakout gathers momentum.

If, on the other hand, it could move as high as 8000 and break decisively upwards out of this triangle, then it wouldn’t be at all surprising to see it reach 9000 or 10,000 once again, but in this economic climate, this seems unlikely in my opinion.

Final Thoughts

It’s important to point out that these are just my own thoughts and opinions, and is not intended to be financial advice. It’s perfectly possible that there could be a false breakout and the price remains range-bound for the foreseeable future.

However it is still interesting to see how these descending triangles unwind because they will often end with a significant price move upwards or downwards, and with so much sideways price action in recent weeks, that may well happen here with Bitcoin.

You can be sure that many other traders and investors are waiting for some kind of breakout, so as is so often the case, it may become a self-fulfilling prophecy once traders jump on board and trade the resulting breakout as soon as it occurs. Stay tuned.

Filed Under: News Tagged With: bitcoin, breakout

USD/JPY Analysis November 2019 – Downward Breakout Possible

November 25, 2019 by James Woolley Leave a Comment

Price Action

It has been interesting to watch the price action of the USD/JPY pair in recent months because after hitting a low of around 104.46 back in August, it has been slowly trending upwards since then, and currently trades at 108.80 at the time of writing.

Indeed as you can see from the price chart below, the price has bounced back so much, it has not only touched the 200-day exponential moving average (as indicated by the red line), but has also traded above it for quite a while.

USDJPY Daily Chart - November 2019

Downward Price Breakout

You can also see from the chart above that it was clearly trending within two trendlines that marked the high and low points of this rising trend, but significantly closed below the lower trendline last week.

To be honest, I was expecting that this would probably mark the end of the recent uptrend, and would be the catalyst for a new downward move for the USD/JPY, but so far there hasn’t been a wave of selling to drive the price lower.

This is probably because some analysts, including Goldman Sachs, have been talking down the prospects of a recession in the US and global economy in 2020, predicting growth rates of 2.3% and 3.4% respectively for the coming year.

Nevertheless, there is still a possibility of a strong bearish candle forming on the daily chart in the next few days, so it could still be worth watching.

Future Price Moves

If the price does trade strongly lower, and closes below its two recent lows of 108.24 and 108.28, then I would be fairly confident that this would signal the start of a new downward price breakout.

As a result of this, the price would close below all of its major moving averages (20, 50, 100 and 200-day EMAs) and there is a lot of downside potential because it could easily drop back into the 104 – 106 range.

The alternative scenario is that the recent short-term strength in the USD/JPY continues, and we continue to see the price trading upwards of 109.

If this were to happen, then we would see the 50 and 100-day EMAs cross over the EMA (200), which is a very bullish signal that could attract a wave of buying to push the price above its previous highs of 109.50 and beyond the 110 level.

So the point is that while the picture is still unclear, the price action of the USD/JPY over the coming days and weeks could give you a strong indication as to whether there is going to be a sustained upwards or downwards trend in the near future.

I would probably favour a downward breakout at this moment in time simply because the MACD and stochastic indicators are suggesting that this long-term upward trend is running out of momentum on the weekly chart, but as I say, there is no need to second-guess the direction of any breakout until we get some clearer signals on the daily chart.

Filed Under: Analysis Tagged With: breakout, usdjpy

Bitcoin Update 27 September 2019 – Breakout Confirmed

September 27, 2019 by James Woolley Leave a Comment

Descending Triangle Breakout

Last week I was discussing the descending triangle that had formed on the price chart of Bitcoin, and highlighted how it was trading in an ever decreasing trading range prior to a possible breakout.

Here is the chart from this previous blog post:

Bitcoin Trading Range in September

Well as expected, the price couldn’t stay in this trading range forever, and it eventually closed below this long-established trading range earlier this week, as you can see below:

Bitcoin Breakout - September 2019

8000 Level Breached

The closing price of the breakout candle was $8693, which is where many people will have opened a short position, and it was no real surprise that the price continued to fall in the following days.

That’s because many traders will have been watching this descending triangle for many months, and will have been waiting to trade any breakout that subsequently occurred.

The price of Bitcoin actually fell below the $8000 level to around $7739 before bouncing back to its current price of around $8050.

So the breakout could have yielded nearly $1000 x the initial stake per point for anyone brave enough to trade this breakout, and even exiting at $8000, which would have been an obvious exit point for many traders, would have generated a profit of $693 x stake per point (minus the spreads).

Disclaimer – Bitcoin and other cryptocurrencies are highly speculative instruments, and it is possible to lose all of your capital.

Of course this breakout is still very much in its infancy, so there is still every chance that the price could drop even lower than its recent low of $7739, generating even more profits for those traders who decided to trade this breakout.

Sentiment

It is often interesting to look at market sentiment for any given market to see how bullish or how bearish traders are in general, and looking at the Bitcoin market on IG.com, 83% of clients with open positions are expecting the price to rise, and 17% are expecting the price to fall.

On eToro 98% of customers are buying Bitcoin at the time of writing, so these two stats would suggest that people are still very bullish on the long-term prospects of Bitcoin despite this downward breakout.

Final Thoughts

As I mentioned before, I don’t actually trade cryptocurrencies myself because of the risks attached and the relatively large spreads, but it is clear that these markets still conform very well to technical analysis because this was a textbook descending triangle breakout that has already yielded an excellent profit and may still fall even further.

With regards to future price predictions, I said in my last post that $8000 was within reach if there was a downward breakout and this has already been taken out. So I’m not really sure how much further it can fall in the near term.

It may well find a base at this new level and start to bounce back, or it could easily drop below $7000 if we have a few days where it closes below the psychological $8000 level. Either way, it should be interesting to watch.

Filed Under: News Tagged With: bitcoin, breakout

  • « Previous Page
  • 1
  • 2
  • 3
  • 4
  • …
  • 9
  • Next Page »

Forex Rebates:

Choose from 40+ different forex brokers and crypto exchanges, and get cashback every time you trade:


Copy Profitable Traders:

If you join ZuluTrade, you can follow and subscribe to profitable traders and all of their trades will be automatically copied in your own trading account.

You can also earn money as a signal provider if you are already a profitable trader.

Click here to find out more

Recommended Broker:

Recent Blog Posts:

  • High Probability Trade on S&P 500 – 26 January 2024
  • Oanda Moves Into Prop Trading With Labs Trader Program
  • My eToro Performance in 2023 – Up 33.24%
  • The5ers Offering $20K Bootcamp Challenge For Just $1
  • Example of VWAP Bounce Trade on S&P 500 – 18 December 2023

Recent Articles:

VWAP Indicator
  • MA Sabres (LuxAlgo) Indicator
  • 10 Harsh Truths About Forex Trading
  • Best Websites for Monitoring Currency Strengths
  • Xmaster Formula Indicator for MT4 and MT5
  • Tools:

    Currency Heat Map

    Categories

    • Analysis
    • News

    Archives

    • January 2024
    • December 2023
    • November 2023
    • October 2023
    • September 2023
    • August 2023
    • July 2023
    • June 2023
    • May 2023
    • August 2020
    • June 2020
    • May 2020
    • April 2020
    • January 2020
    • December 2019
    • November 2019
    • October 2019
    • September 2019
    • August 2019
    • July 2019
    • June 2019
    • May 2019
    • April 2019
    • March 2019
    • February 2019
    • January 2019
    • December 2018
    • November 2018
    • October 2018
    • September 2018
    • August 2018
    • July 2018
    • June 2018
    • May 2018
    • March 2016
    • December 2015
    • November 2015
    • October 2015
    • August 2015
    • July 2015

    Disclaimer

    This website should be used for general information purposes only and in no way represents professional financial advice.

    Forex and CFD trading carries a high level of risk and it is possible to lose more than your initial deposit if using leveraged products.

    Copyright © 2025 · eleven40 Pro Theme on Genesis Framework · WordPress · Log in

    • About
    • Contact
    • Disclosure
    • Privacy Policy
    • Terms Of Service