The Forex Chronicles

  • Rebates
  • Brokers
  • News
  • Analysis
  • Signals
    • Best Copy / Social Trading Platforms
    • eToro Review
    • FXTM Invest Review
    • Marketclub Review
    • ZuluTrade Review
  • Indicators
  • Strategies
  • Articles

USD/JPY May Be Poised for an Inside Bar Breakout – February 2019

February 11, 2019 by James Woolley Leave a Comment

Price Action

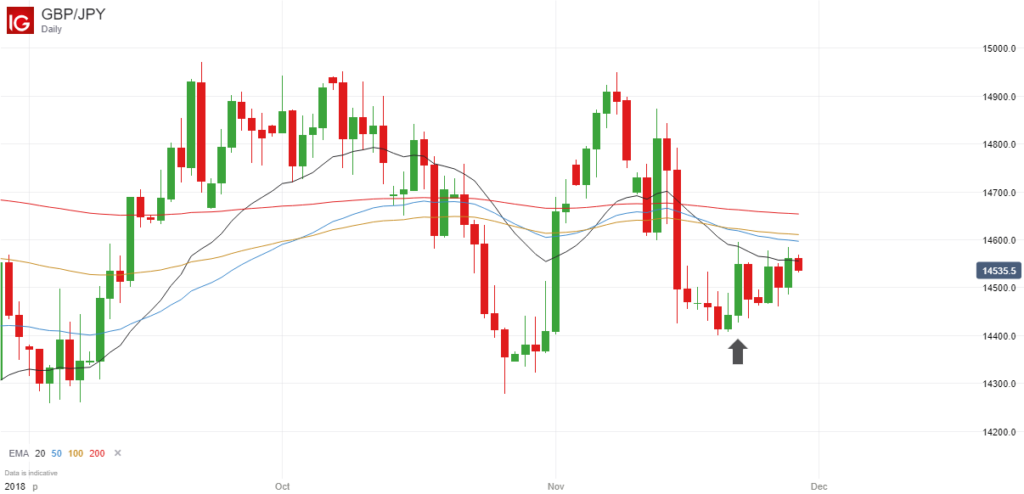
The US dollar has been very strong in recent weeks, as you can see for yourself if you look at the charts of the various dollar pairs.

However in this article I want to take a closer look at the USD/JPY pair in particular because although this pair is also trading higher, and is now close to the 110 level, it could also be gearing itself for a breakout.

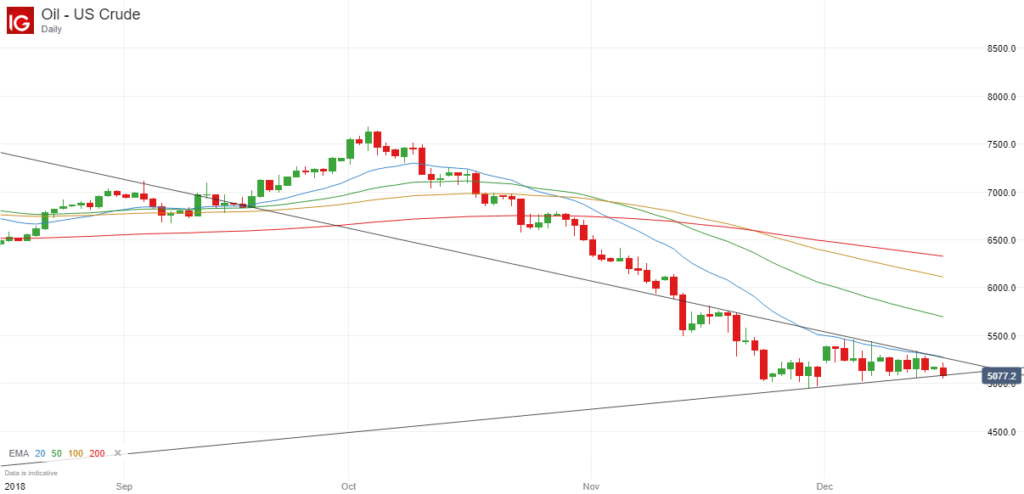
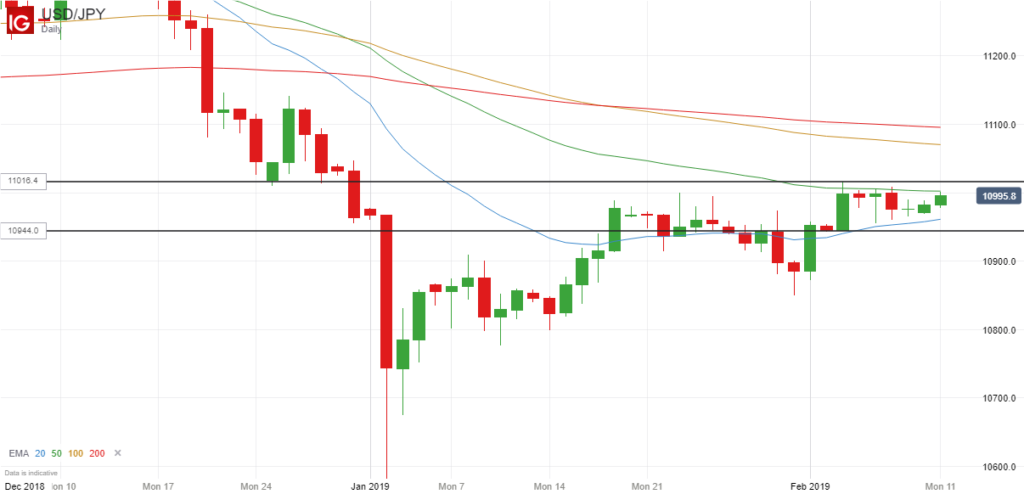
It is not yet clear which direction this breakout will be, but we have had a lot of sideways price action in recent days, and the exponential moving averages are starting to converge on the daily chart and are all trading very close to each other (which often happens before a significant breakout):

USDJPY Inside Bar Formation - February 2019

Inside Bar Formation

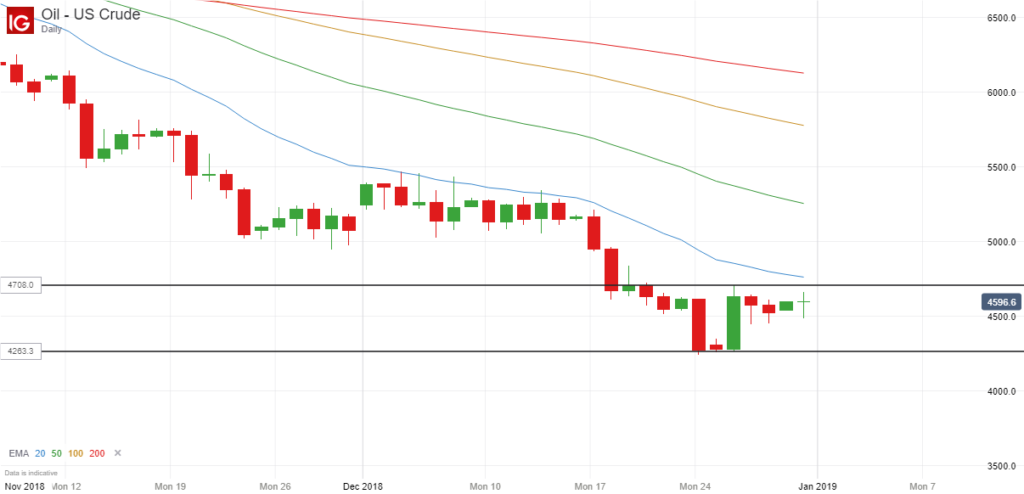
Most importantly of all, you can see from the chart above that we now have an inside bar formation where the last 5 candles (6 if you include the Sunday candle) are all trading within the range of the large candle from last Monday (indicated by the two black lines).

This is one of the main things I like to look for when trying to identify possible breakouts because the longer the price trades within the range of a previous candle, the more likely it is for the price to break strongly upwards or downwards when it eventually closes outside of this range.

Trading Opportunity

Subsequently, it might be worth watching the price of the USD/JPY over the coming days to see if it can break decisively out of this range. The high from the initial set-up candle is 110.16 and the low is 109.44, so these are the key levels to look out for.

Some people like to jump into a trade as soon as the price moves above or below the high or the low, but I personally think it is better to wait for the daily candle to close to see if it actually closes outside of the range. Then it is far more likely to be a confirmed breakout in my experience.

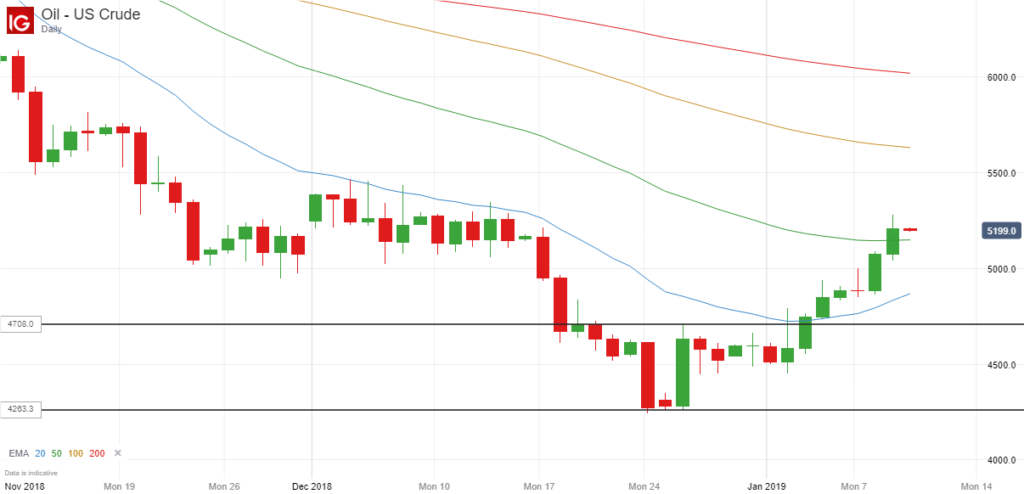
If it breaks higher, then the 200-day moving average is an obvious price target, which currently stands at 111, but I wouldn’t be at all surprised to see the price continue to break above this moving average to around 112.

If, on the other hand, it breaks lower, then I would expect it to test its recent low from last month, which is about 108.5, and possibly go as low as 108, but we will just have to wait and see what happens.

Please bear in mind that these are just my own thoughts and opinions, and it doesn’t represent professional financial or trading advice in any way.

Filed Under: Analysis Tagged With: breakout, inside bar, usdjpy

Crude Oil’s Price Move Highlights Profitability of Inside Bar Breakouts

January 10, 2019 by James Woolley 1 Comment

Inside Bar Breakouts

I have long argued that inside bar breakouts are some of the easiest and most predictable breakouts that you can trade.

All you need to do is wait for quite a large candle on the daily chart (or higher), and wait for a series of consecutive inside bars that all trade within the range of this initial candle.

Then once the price eventually closes above or below the initial candle, you can then enter a trade in the same direction, and profit from the momentum of the breakout.

Real Life Example – US Crude Oil

To demonstrate the effectiveness of this simple trading strategy, here is the daily chart of US crude oil that I posted on this website at the start of the month:

US Crude Oil Inside Bars - 1 January 2019

….. and this is what happened when the price finally closed outside of the range of the initial set-up candle:

US Crude Oil Breakout - January 2019

As you can see, there was initially a false breakout where the price moved above but failed to close above the initial candle, followed by a secondary breakout where the price did indeed close above this candle, and this would have been the time to enter a long position.

Once this happened, the price moved strongly higher and went straight to $50, which would have been a natural exit price, but it actually had the momentum to keep on moving higher, and currently stands at around $52.

It could potentially go higher as well because it is still quite a long way below both the 100 and the 200-day moving averages, as shown on the chart above.

Final Thoughts

So hopefully you can see that you don’t necessarily need to use lots of fancy indicators to come up with a winning strategy.

The simplest strategies are often the most profitable, and I always found that inside bar breakouts in particular are generally some of the most predictable and profitable breakouts that you can trade.

The only real drawback is that they don’t occur all that often. So you may have to wait patiently for a really good set-up to occur across all of the major forex pairs and commodities. Alternatively you can apply this strategy to some of the other markets that you like to trade, such as cryptocurrencies or ETFs, for example.

Filed Under: Analysis Tagged With: breakout, inside bar, oil, us crude

US Crude Oil Update – 1 January 2019

January 1, 2019 by James Woolley Leave a Comment

Previous Breakout

A few weeks ago I highlighted a possible breakout that was shaping up on the daily chart of US crude oil, and as it turned out, this would have been a very profitable trade:

US Crude Oil Breakout - December 2018

After breaking out of the previous trading range and closing below the lower trendline, the price went from around $49.50 to as low as $42.44 in a relatively short period of time.

Inside Bars

Since then, the price has recovered somewhat and is now trading around the $45 – $46 level, having moved relatively little during this quiet Christmas and New Year period.

However it is interesting to note that an inside bar formation has formed on this same daily chart, which suggests that there may be a possible breakout in the next few days.

US Crude Oil Inside Bars - 1 January 2019

What I am basically saying is that after the large bullish candle on 26 December 2018, there have been 3 consecutive inside bars / candles (4 if you include the Sunday session) that have all traded within the range of this particular candle.

Trading Opportunity

This is often a very good set-up if you are looking to trade breakouts because traders will often spot the same breakout themselves and pile into a position once the price closes above or below the initial set-up candle, helping it to become a self-fulfilling breakout for everyone.

In this case, an upward breakout is looking more likely simply because it is trading closer to the high of the initial candle, and we are long overdue a bounce as the price of oil dropped so much last year.

Therefore if the price closes above $47.08 in the coming days without closing too far above this level, this could be a good opportunity to open a long position.

$50 would be an obvious resistance level, so it might be a good idea to target an exit price just below $50, but if it could break through this level, then the price could potentially surge towards the 100 and 200-day EMAs, which are currently at $57.76 and $61.26 respectively.

I personally think the first outcome is more likely because I think it will struggle to break through the $50 at the current time.

If the price doesn’t close above the high of the initial candle and instead breaks below the low of this candle, and indeed the low of the previous candle a few days earlier, then this will really open up the downside.

This would see the price drop to around $42, and if it closed around this level, you could then expect the price to fall below $40 fairly easily.

However at the moment we just have to wait and see what happens. What I will say is that the longer the price trades within the range of the initial set-up candle, the stronger the breakout is likely to be.

As always, please note that these are just my own thoughts and opinions. This doesn’t represent professional trading or financial advice in any way.

Filed Under: Analysis Tagged With: breakout, oil, us crude

Possible Breakout on US Crude Oil – December 2018

December 17, 2018 by James Woolley Leave a Comment

Recent Price Action

The price of US crude oil has been trading in quite a narrow sideways trading range in recent times, and seems to have stabilized between $50 and $55 with no clear direction.

However if you draw some trendlines on the daily chart of this particular commodity, you can see that the range is getting smaller all the time, and therefore a breakout is becoming increasingly likely:

US Crude Oil Daily Chart - December 2018

Downward Breakout?

At the time of writing this article, the price has actually dipped below the lower trendline ever so slightly, hinting at a possible breakout, however it is still too early to call.

That’s because you really need to wait for the price to close decisively outside of an established trading range before trading breakouts.

So in this instance we will need to wait until the candle closes at the end of the trading session before seeing if this is an actual breakout or not.

I think it is fair to say that most traders are actually expecting the price of crude oil to bounce back rather than break lower because 89% of traders have long positions on eToro, and 87% of traders have long positions on IG Index, for example.

Therefore it will be interesting to see what happens in the coming hours and days.

Possible Price Targets

If the price does indeed break decisively below the lower trendline, then it could easily fall below $50 to around $48, and possibly as low as $45, although it is very hard to set any price targets with any real accuracy right now.

The fact that we are entering a quiet period of the year for the markets, ie Christmas and New Year, means that volumes are a lot lower, and as a result of this, price moves are harder to forecast because any price swings that occur can either be exaggerated or thwarted by low volumes.

I personally would be a lot more confident about trading an upward breakout because the price has already fallen quite substantially since the start of October. Therefore I would look for the price to close around the $53 level or higher before considering opening a long position, as so many traders are predicting.

However these are just my own thoughts and opinions. This in no way represents financial or trading advice of any kind.

I just thought I would alert you to a possible breakout that could be about to take place on US crude oil as we head into Christmas.

Filed Under: Analysis Tagged With: breakout, oil, us crude

Possible Inside Bar Breakout On GBP/JPY Pair – 29 November 2018

November 29, 2018 by James Woolley Leave a Comment

Introduction

The GBP pairs have been almost impossible to trade just recently because of the ongoing uncertainties surrounding Brexit, which is why it is sometimes a good idea to just wait for a breakout from an established trading range.

Therefore with that in mind, it may be worth taking a look at the GBP/JPY pair right now because there has recently been a series of four consecutive inside bars (five if you include Sunday’s trading session).

So in other words, after the large candlestick from last Thursday, the price has traded within the range of this candle every day since then, as you can see in the chart below:

GBPJPY Inside Bars - 29 November 2018

Why is This Significant?

These inside bars highlight a period of uncertainty because the price has failed to break above or below the respective high and low of this candle since then.

In addition, you will also notice that the EMAs that I like to use (20, 50, 100 and 200) are all closely bunched together, which often occurs before a breakout.

Therefore when the price does eventually break above or below this initial candle from last Thursday, there may well be a decent breakout.

Trading Opportunity

With four consecutive inside bars, the likelihood of a major breakout continues to grow, so it might be a good strategy to enter a long order a few pips above the high of the initial candle (14595.9), and enter a short order a few pips below the low of this candle (14426.5) in case there is a downward breakout.

There is the potential for the price to break through the EMA (200) if there is an upwards breakout, and this may be a good place to close half the position, while the price could test the recent lows at around 142.50 if there is a downward breakout.

However, as always, I am not offering any trading advice and am not recommending any trades. These are just my own personal views and observations.

Filed Under: Analysis Tagged With: breakout, gbpjpy, inside bar

  • « Previous Page
  • 1
  • 2
  • 3
  • 4
  • 5
  • 6
  • …
  • 9
  • Next Page »

Forex Rebates:

Choose from 40+ different forex brokers and crypto exchanges, and get cashback every time you trade:


Copy Profitable Traders:

If you join ZuluTrade, you can follow and subscribe to profitable traders and all of their trades will be automatically copied in your own trading account.

You can also earn money as a signal provider if you are already a profitable trader.

Click here to find out more

Recommended Broker:

Recent Blog Posts:

  • High Probability Trade on S&P 500 – 26 January 2024
  • Oanda Moves Into Prop Trading With Labs Trader Program
  • My eToro Performance in 2023 – Up 33.24%
  • The5ers Offering $20K Bootcamp Challenge For Just $1
  • Example of VWAP Bounce Trade on S&P 500 – 18 December 2023

Recent Articles:

VWAP Indicator
  • MA Sabres (LuxAlgo) Indicator
  • 10 Harsh Truths About Forex Trading
  • Best Websites for Monitoring Currency Strengths
  • Xmaster Formula Indicator for MT4 and MT5
  • Tools:

    Currency Heat Map

    Categories

    • Analysis
    • News

    Archives

    • January 2024
    • December 2023
    • November 2023
    • October 2023
    • September 2023
    • August 2023
    • July 2023
    • June 2023
    • May 2023
    • August 2020
    • June 2020
    • May 2020
    • April 2020
    • January 2020
    • December 2019
    • November 2019
    • October 2019
    • September 2019
    • August 2019
    • July 2019
    • June 2019
    • May 2019
    • April 2019
    • March 2019
    • February 2019
    • January 2019
    • December 2018
    • November 2018
    • October 2018
    • September 2018
    • August 2018
    • July 2018
    • June 2018
    • May 2018
    • March 2016
    • December 2015
    • November 2015
    • October 2015
    • August 2015
    • July 2015

    Disclaimer

    This website should be used for general information purposes only and in no way represents professional financial advice.

    Forex and CFD trading carries a high level of risk and it is possible to lose more than your initial deposit if using leveraged products.

    Copyright © 2025 · eleven40 Pro Theme on Genesis Framework · WordPress · Log in

    • About
    • Contact
    • Disclosure
    • Privacy Policy
    • Terms Of Service