The Forex Chronicles

  • Rebates
  • Brokers
  • News
  • Analysis
  • Signals
    • Best Copy / Social Trading Platforms
    • eToro Review
    • FXTM Invest Review
    • Marketclub Review
    • ZuluTrade Review
  • Indicators
  • Strategies
  • Articles

A Perfect Early Morning Breakout Trade – 27 November 2018

November 27, 2018 by James Woolley Leave a Comment

Introduction

I used to trade early morning breakouts quite a lot in the past, and to be honest, I have forgot just how profitable they can be.

The downside is that you need to be at your computer early in the morning between about 6 AM and 8AM (UK time), which is why I haven’t really had the opportunity to trade these breakouts recently, but if you are available at this time, you can get some strong and predictable price moves.

As you may have discovered yourself, the GBP/USD is a very difficult pair to trade right now because it is so sensitive to any Brexit announcements, and seems to be waiting for any many major developments before moving strongly in either direction.

That’s why short-term day trading may be the best way to trade this pair right now, and early morning breakouts are ideal because an average trade may only last about an hour or two at the most, and they obviously occur early in the day when there is unlikely to be any market-moving news other than the occasional economic data release.

How To Trade These Breakouts

The key to success with this type of strategy is to wait until you have a very small overnight trading range between 12 AM and 6AM on one or more of the major forex pairs, and then trade the subsequent breakout on a short-term chart (I like to use the 5-minute chart).

It is imperative that you have a tight overnight trading range in comparison to the average trading range because then there is the potential for the price to move a lot more when it does break out of this range. Therefore you may not necessarily get a decent set-up every day.

Once the price breaks out, which could be before or after the London market opens, you can enter a long or a short position when the 5-minute candle closes, and either scale out of the trade in stages, moving your stop loss to break-even as soon as possible to effectively ensure a free trade, or set yourself a price target based on the chart.

I have found that pivot points act as excellent price targets because the price will often be driven upwards or downwards to hit these key points on the charts.

GBP/USD Breakout From Earlier Today

To show you how effective this breakout strategy can be, you only need to look at how the GBP/USD traded earlier today.

GBPUSD Early Morning Breakout - 27 November 2018

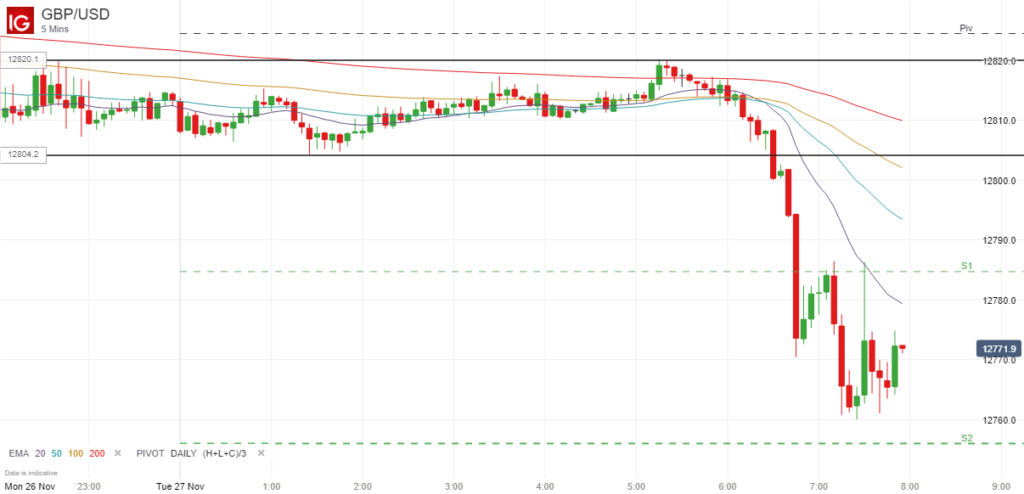
In this instance the price traded within a really tight trading range of just 15.8 points between 12 AM and 6 AM, compared to the average daily trading range of 101.8 points, and so when the price broke strongly downwards out of this range and closed at around 1.2800 on the 5-minute breakout candle, this would have been a good place to enter a short position.

As you can see, the price went straight down to the S1 pivot point level, which would have been a good place to exit your position or close half and move your stop to break-even, and the price actually continued to fall, falling just short of the S2 level.

All this happened before the London market opened, so the point is that you can find some profitable early morning breakout trades if you are available to trade at this time.

Of course not all of these breakouts will be profitable, but if you wait for the very best set-ups with very narrow overnight trading ranges, you should hopefully have more winning trades than losing ones.

Filed Under: News Tagged With: breakout, early morning breakout, gbpusd

Dow Jones Trading in Symmetrical Triangle Heading into Thanksgiving

November 20, 2018 by James Woolley Leave a Comment

Price Action

The markets have been fairly turbulent in recent weeks. After a big sell-off that took the Dow Jones all the way down to 24,120, the markets bounced back and the Dow went on to hit a high of 26,278.

However despite this temporary strength, I think many traders and investors were wary that this may be a dead cat bounce and further weakness may be just around the corner, and this has proven to be the case so far because the Dow has since fallen back to 24,902 at the time of writing (based on the future price pre-opening).

Dow Jones Symmetrical Triangle - November 2018

Symmetrical Triangle and EMA Convergence

If you take a look at the daily price chart of the Dow Jones above, you can see that the price has been trading in a symmetrical triangle if you draw some trendlines connecting the highs and the lows of the recent price action.

Furthermore, you can also see that the EMAs that I like to use, ie the 20, 50, 100 and 200-period EMAs, have all converged and are tightly packed together.

Both of these chart patterns generally point to a possible breakout when they occur together, and with the symmetrical triangle getting smaller and smaller every day, a breakout is looking highly likely right now.

Trading Opportunity

At the moment the price is trading very close to the bottom of the triangle, and is therefore very close to breaking below the lower trendline and breaking out to the downside.

However it is still unclear whether the price is actually going to break below this trendline or whether it will find support at this level.

You would normally expect the price to continue falling, but we are now in Thanksgiving week, which is usually a very good week for the major stock markets, with the S&P 500 higher 75% of the time since 1945, for example.

So any downward breakout may be curtailed by a short-term rally during the remainder of Thanksgiving week, and with Christmas just around the corner, there could well be a Santa rally to look forward to in about a month’s time.

Therefore while this would ordinarily be a possible breakout opportunity, you have to be very careful if you are tempted to sell any downward breakout. Indeed I wouldn’t be at all surprised if the upper trendline is breached in the coming weeks.

Filed Under: Analysis Tagged With: breakout, dow jones

Bitcoin Finally Breaks Out… But To The Downside

November 15, 2018 by James Woolley Leave a Comment

Bitcoin’s Trading Action

The price of Bitcoin has remained steady for quite some time now because it has continued to trade within a fairly predictable sideways trading range between around $5900 and $6800.

I think it is fair to say that many people, particularly those people who have purchased some Bitcoins as a long-term investment, expected the price to eventually break upwards out of this trading range when the breakout finally happened.

Therefore I think many will have been shocked to see the price drop sharply downwards yesterday. The price hit a new low for 2018 of $5304, according to my IG chart, but has since recovered slightly to $5555 at the time of writing. However it is still well below the previous trading range, as you can see below:

Bitcoin Downward Breakout - November 2018

Cryptocurrency Sell-Off

It is not just Bitcoin that has experienced heavy price falls either because all of the other major cryptos have dropped sharply.

Bitcoin Cash experienced the biggest falls, but cryptos such as Ethereum, Litecoin and Ripple were also affected.

The question is; is this the end for cryptocurrencies, or this just a temporary set-back?

Future of Cryptocurrencies

The reality is that no-one really knows. I personally have never purchased any cryptocurrencies or traded them long or short, and don’t really intend to either because to me it is just gambling.

Yes these assets could well be the future and the price could easily move dramatically higher in the future, but they could just as easily become completely worthless in a few years.

Some of the most well-known cryptos may not be around in a few years time, and there may end up being one or two dominant ones that make all the other ones practically worthless. Indeed the biggest cryptos in 2020 in beyond may not even have been invented yet.

As I say, there is just too much uncertainty to trade these assets with any real confidence, but at least now we have finally seen a breakout on Bitcoin, even it is a negative breakout. This should create some decent trading opportunities for those traders who like to trade these assets on a short or medium-term basis.

Filed Under: News Tagged With: bitcoin, breakout, cryptocurrencies

Possible Breakout on the EUR/JPY Pair – October 2018

October 17, 2018 by James Woolley Leave a Comment

Breakout Criteria

There are various factors that I will consider when looking for potential breakout trades, but one of my favorite patterns is when you get a combination of a moving average cluster and a sideways trading range.

In other words, I like to see the 20, 50, 100 and 200-period exponential moving averages all trading close together because this indicates a period of consolidation and indecision, and is often the pre-cursor to a big breakout.

Similarly, I like to see the price trading in a consistent trading range close to these moving averages because this makes it easier to detect a breakout, and gives you a natural entry point because you just enter a long position when the price closes above this range or a short position when the price closes below this range.

I have just found that both of these criteria are present on the daily chart of the EUR/JPY pair, so this could potentially develop into a good trading opportunity:

EURJPY Potential Breakout - October 2018

Trading Opportunity

What I like about this set-up is that the trading range is currently very narrow, which is always a good thing because you can potentially make more profits, and can make your stop losses smaller if you place them just outside this range.

The only real danger is that you sometimes get a few false breakouts before the big one, which could happen here, but there is still the potential for the price to move at least 200 points in either direction.

A breakout to the upside could see the price retest its highs from last month at around 133.00, with 132.00 as a first target and potentially a price to close half the position and move the stop loss up to break-even.

A breakout to the downside, meanwhile, would see 128.00 as the first target because this was a recent support level, and if the price breaks through this level, then 126.00 could easily be attained.

It should always be pointed out that breakouts are not always profitable because you sometimes get false moves, and I am not certainly not recommending any trades. These are just my own thoughts and opinions.

The key to success with any strategy is to keep your losing trades small, and let your winning trades run, and this applies to breakout strategies as well.

Filed Under: Analysis Tagged With: breakout, eurjpy

Gold Price Breakout – October 2018

October 15, 2018 by James Woolley Leave a Comment

Previous Price Action

The price of gold has been trading in a sideways trading range for the last few months, struggling to break decisively above or below the $1200 level.

This can be seen in the chart below because you can see that the price has been trending within the upper and lower trendlines for many weeks now.

Gold Breakout - October 2018

It seemed that there needed to be a catalyst to move the price strongly upwards or downwards to break out of this range, and last week’s stock market mini-crash provided this catalyst.

Safe Haven

In times of uncertainty, people often sell some of their stocks to preserve their capital and invest it into something a little safer and less risky, and gold is often seen as a perfect safe haven for this cash.

Therefore it was no surprise at all that the price of gold surged higher last week after the big sell-off because this happens fairly regularly.

As a result of this increased buying, the price of gold broke upwards out of this trading range, and is currently trading at $1232 at the time of writing.

Trading Opportunity

If you are someone who likes to trade price breakouts, you probably would have entered a long position at the close of the breakout candle, and would now be in profit slightly because the price has continued edging higher at the start of the London session.

Indeed the breakout candle closed at $1223, so this breakout trade is already $9 in profit at the time of writing.

I myself didn’t really like the look of this breakout because there was a very large breakout candle, and when this happens you will often get quite a large pull-back, and are then sitting on a loss, and sometimes the breakout quickly runs out of momentum.

Furthermore, I thought that there may be limited upside from here because the EMA (200) currently stands at $1245, which is likely to act as a strong resistance level.

There are some breakouts that look ripe for a trade, and others that are a little unconvincing, and I would say that this latest gold breakout is still a little unconvincing, which is why I will not be trading this breakout at any point, even after it broke higher today.

The reason why I say that is because we have already seen a slight recovery in the stock market, and there seems to be a little support right now that is holding the price of the major US markets up.

So if the markets do happen to bounce back this week, which could happen, this will likely have the opposite effect on gold, and the price may well fall back within in the previous trading range.

This has turned out to be a good breakout trade for those that had the courage to trade it, particularly if they have already moved their stop loss up to break-even because it is now a risk-free trade, but I never really felt that this was a high probability set-up.

I am prepared to wait for high probability set-ups where the odds of success are much higher. The price of gold could easily touch the EMA (200) and possibly break through it, but it’s no problem at all if this occurs. It’s just something you have to accept as a trader.

Filed Under: News Tagged With: breakout, gold

  • « Previous Page
  • 1
  • …
  • 3
  • 4
  • 5
  • 6
  • 7
  • …
  • 9
  • Next Page »

Forex Rebates:

Choose from 40+ different forex brokers and crypto exchanges, and get cashback every time you trade:


Copy Profitable Traders:

If you join ZuluTrade, you can follow and subscribe to profitable traders and all of their trades will be automatically copied in your own trading account.

You can also earn money as a signal provider if you are already a profitable trader.

Click here to find out more

Recommended Broker:

Recent Blog Posts:

  • High Probability Trade on S&P 500 – 26 January 2024
  • Oanda Moves Into Prop Trading With Labs Trader Program
  • My eToro Performance in 2023 – Up 33.24%
  • The5ers Offering $20K Bootcamp Challenge For Just $1
  • Example of VWAP Bounce Trade on S&P 500 – 18 December 2023

Recent Articles:

VWAP Indicator
  • MA Sabres (LuxAlgo) Indicator
  • 10 Harsh Truths About Forex Trading
  • Best Websites for Monitoring Currency Strengths
  • Xmaster Formula Indicator for MT4 and MT5
  • Tools:

    Currency Heat Map

    Categories

    • Analysis
    • News

    Archives

    • January 2024
    • December 2023
    • November 2023
    • October 2023
    • September 2023
    • August 2023
    • July 2023
    • June 2023
    • May 2023
    • August 2020
    • June 2020
    • May 2020
    • April 2020
    • January 2020
    • December 2019
    • November 2019
    • October 2019
    • September 2019
    • August 2019
    • July 2019
    • June 2019
    • May 2019
    • April 2019
    • March 2019
    • February 2019
    • January 2019
    • December 2018
    • November 2018
    • October 2018
    • September 2018
    • August 2018
    • July 2018
    • June 2018
    • May 2018
    • March 2016
    • December 2015
    • November 2015
    • October 2015
    • August 2015
    • July 2015

    Disclaimer

    This website should be used for general information purposes only and in no way represents professional financial advice.

    Forex and CFD trading carries a high level of risk and it is possible to lose more than your initial deposit if using leveraged products.

    Copyright © 2025 · eleven40 Pro Theme on Genesis Framework · WordPress · Log in

    • About
    • Contact
    • Disclosure
    • Privacy Policy
    • Terms Of Service