The Forex Chronicles

  • Rebates
  • Brokers
  • News
  • Analysis
  • Signals
    • Best Copy / Social Trading Platforms
    • eToro Review
    • FXTM Invest Review
    • Marketclub Review
    • ZuluTrade Review
  • Indicators
  • Strategies
  • Articles

Possible Pennant Breakout for GBP/JPY Pair in October 2018

October 10, 2018 by James Woolley Leave a Comment

Brexit Weighing Heavily on GBP Pairs

The GBP pairs continues to be heavily influenced by Brexit, which obviously makes them difficult to trade because one piece of positive or negative news can result in huge price movements in either direction.

Therefore if you do want to trade these pairs, it is probably best to concentrate solely on technical analysis, use strict stop losses to hopefully avoid any major wipeouts and be aware of when any Brexit negotiations or speeches are taking place.

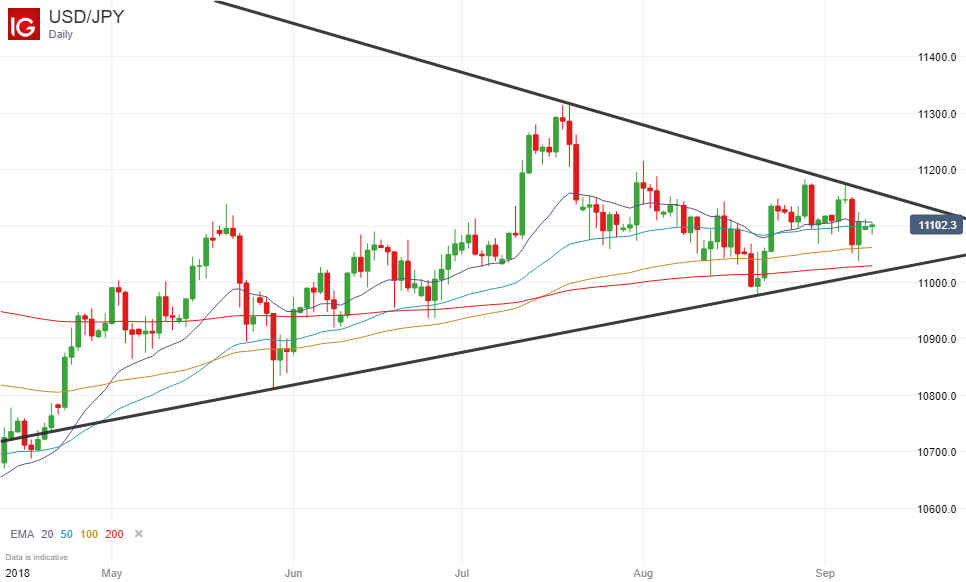
With this in mind, one of the most interesting looking pairs right now is the GBP/JPY pair because after trending upwards for the last few months, we have seen some indecisiveness in recent weeks and a pennant has formed on the daily price chart:
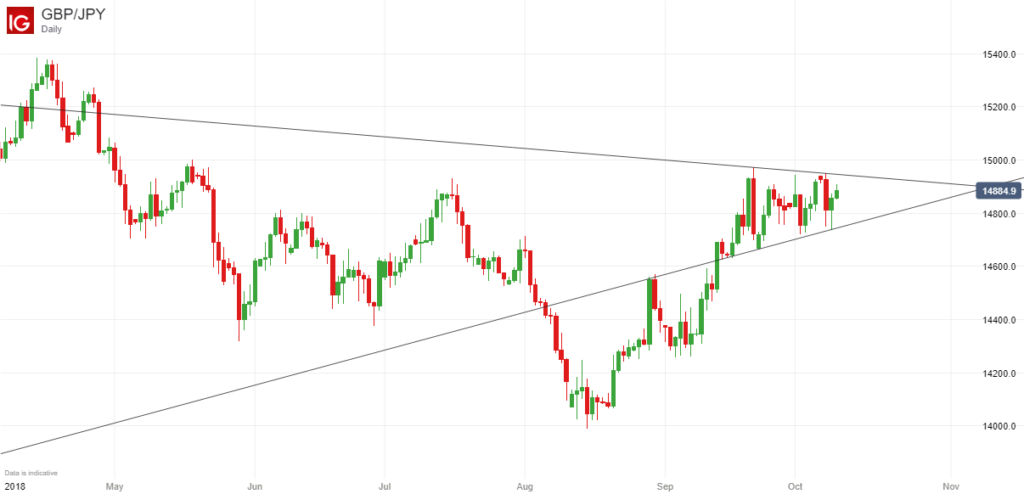
GBPJPY Pennant - October 2018

Pennant Breakout?

Pennant breakouts can be very profitable to trade because many traders will spot the same pattern and will trade the subsequent breakout, and so it might be worth watching for a possible breakout on the GBP/JPY pair.

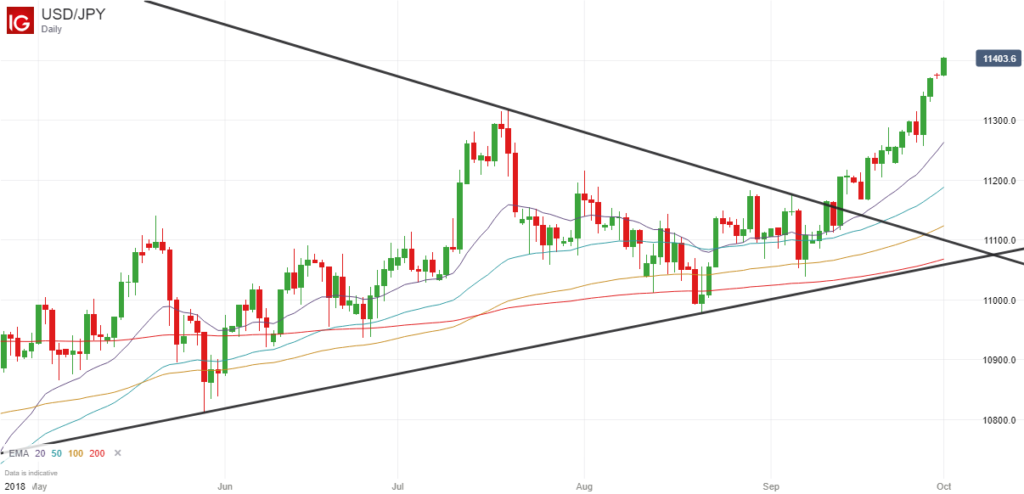
A breakout to the upside would see a resumption of the previous uptrend, and if the price could close strongly above the 150.00 level, which is a major round number and a big psychological resistance level, there is the potential for the price to move higher and test the next resistance level at 154.00, which is a previous high from April.

A breakout to the downside would see a resumption of the long-term downward trend that has been present throughout 2018, and we could potentially see a much stronger price move.

Using fibonacci retracement levels as a guide, a 50% retracement of the previous upward trend would give a price target of 144.81, whilst a 61.8% or 100% retracement would give price targets of 143.65 and 140.00 respectively.

Alternatively, another popular strategy to use when trading pennant breakouts is to derive your target prices from the width of the pennant (from the high to the low).

So regardless of the direction of the breakout, your exit price would be equivalent to the width of the pennant, which in this case is around 315 points, or 2 x the width of the pennant if you are confident of a big move, which would be around 630 points.

Final Thoughts

As always, I am not recommending any trades or offering any signals. These are just my own personal thoughts and opinions.

I just want to highlight a pennant that has formed on the GBP/JPY pair and discuss pennant breakouts in general because these can be very profitable when you get the right set-up.

Furthermore, although not all of these subsequent breakouts turn out to be profitable, there is the potential for a big price move in this instance because any major Brexit news could be the catalyst that causes the price to break strongly out of its narrow trading range.

Filed Under: Analysis Tagged With: breakout, gbpjpy, pennant

USD/JPY Soars To 114 After Breakout

October 1, 2018 by James Woolley Leave a Comment

Trading Price Breakouts

If you are new to forex trading, one of the easiest ways to get started is to simply concentrate on trading price breakouts.

The key here is to find currency pairs that are trading sideways in a narrow trading range on the daily chart, draw trendlines connecting the highs and the lows, and wait for the price to close outside of this range with strong momentum.

In an ideal scenario, you also want to see a series of short, mid and long-term exponential moving averages (I use the 20, 50, 100 and 200-period EMAs) all trading close together because this indicates a period of consolidation and indecisiveness, and is a common pattern that you will often see before a strong breakout.

USD/JPY Breakout

If you visit this site regularly, you will know that I will often highlight some of the most promising set-ups, and a few weeks ago I highlighted the potential for the USD/JPY to break out of its current trading range.

This was because it continued to trade within an ever decreasing sideways trading range with little volatility or momentum, and all the EMAs were tightly squeezed together in readiness for a potential breakout.

So as a result of these favorable trading criteria, I said that there was a real chance that we would see a decent breakout if the price breaks through the upper or lower trendline (at around 112 or 110 respectively), and as it turned out, it was the upper trendline that was breached.

USD/JPY Breakout Before and After Results

Here is the pre-breakout chart of the USD/JPY pair….

USDJPY Price Chart - 10 September 2018

….and this is what subsequently happened….

USDJPY Breakout - September 2018

As you can see, the price of the USD/JPY has hit 114 after breaking out of its previous sideways trading range, giving a total profit of around 200 points so far.

Final Thoughts

Of course everyone will trade these breakouts differently. Some traders may look for even more profits, possibly equivalent to two or three times the width of the trading range, for example, while others will scale out of their positions in two stages or will have much smaller profit targets than 200 points.

The point I want to get across is that these price breakouts can be very profitable, and although you do occasionally get a few false breakouts (including a few that I have highlighted in previous articles), the profitable ones will often compensate for the losing ones in the long run if you use strict stop losses and maximize your earning potential with realistic profit targets.

If you want to see a live example of a price breakout, you might want to check out the daily gold chart because this is threatening to break lower and breach its support level, as first pointed out here.

Filed Under: News Tagged With: breakout, usdjpy

Bitcoin’s Peaks Are Getting Lower – Needs To Break Above $7000

September 28, 2018 by James Woolley Leave a Comment

Bitcoin Predictions

It is always interesting to keep an eye on the price of Bitcoin because in the past we have seen some crazy price swings.

Indeed there was a time when it rocketed up to around the $20,000 level and so-called experts were throwing out outlandish price targets.

For example, venture capitalist Tim Draper set a price target of $250,000 and John Pfeffer (a partner of Pfeffer Capital) set a price target of $700,000, while the controversial figure John McAfee suggested that the price of Bitcoin could even hit $1,000,000 by 2020.

Maybe these predictions will come true in the future, but at the moment they seem absolutely crazy based on the recent price action.

Bitcoin’s Recent Price Action

The chart below shows how the price of Bitcoin has moved since April, and it is clear to see that there has been a steady decline downwards.

Bitcoin Chart - September 2018

There have been times when the price has surged higher, but nevertheless the highs have been getting lower and lower, and just recently the price seems to have been stuck in a sideways trading range between around $5800 and $6600, with no real momentum to take it higher.

This week we have seen a little more strength with the price now trading at $6776 at the time of writing, but it is still far too early to call this a bull run.

Upward Price Breakout / Trading Opportunity

If I was looking to trade a possible breakout, I would look for two events to occur.

First of all, I would want the price to close above its most recent September highs ($6774) because this would push the price above the most recent trendline and potentially signal a short-term breakout.

Secondly, I would want to see the longer term trendline being broken because this would show significant strength, and may possibly bring a wave of new buying because it would encourage traders and investors to buy into this upward price breakout.

For these two things to happen, the price of Bitcoin is going to need to break through the $7000 level, and possibly as high as $7200 or $7300 (depending on when it occurs). However this is still quite a big ask because the price has been trading in the $6000s for quite some time now, so there is obviously a chance that it won’t happen at all.

There will be a breakout at some point, but it could easily be a downward breakout below $5800 if this latest breakout attempt fails to materialise.

Please note that these are just my own thought and opinions. I am not providing any trading advice or recommending any trades. Bitcoin trading is exceptionally risky and you should always be aware of these risks before entering any trades.

Filed Under: Analysis Tagged With: bitcoin, bitcoin price, breakout

Gold Continues To Trade In Narrow Range Around $1200

September 25, 2018 by James Woolley Leave a Comment

Death Cross

If you are a regular reader of this site, you will know that I recently posted about the death cross that has just occurred on the weekly chart of gold.

This is basically where the 50-period moving average crosses below the 200-period moving average, and is generally considered to be a very bearish signal.

Since then the death cross has been confirmed, but it hasn’t resulted in a wave of sellers using this as an opportunity to drive the price lower.

This is not unexpected because these weekly signals can take a long time to unwind, but if you drop down to the daily chart, you will see that the price is really struggling for direction right now.

Narrow Trading Range

In recent weeks the price seems to have been glued to the critical $1200 level, and has struggled to break decisively above or below this significant round number with any real momentum or conviction, as you can see below:

Gold Narrow Trading Range - September 2018

So far this month it has recorded a low of $1187.8 and a high of $1214.4, but has remained in a very narrow trading range for several weeks now.

Inside Bar

In addition to trading in a very narrow range, we have also had a series of three consecutive inside bars in the last three trading sessions (if you include the Sunday session), which is always worth noting because these inside bar patterns will often present you with a profitable breakout opportunity when the price closes above or below the initial set-up bar.

Trading Opportunity

From a trading perspective, it is very hard to trade any instrument that is basically trading sideways with no clear direction, but it is still good to see such a pattern because it usually leads to a profitable set-up when the price eventually breaks out of this range.

This is particularly true when you have a series of inside bars within this sideways trading range, as is the case here.

Therefore it might be worth watching the price of gold in the coming weeks because there could be a strong price move when the price closes above or below both the set-up bar and the previous high or low of this trading range.

A downward break would arguably be preferable because we have already seen a death cross on the weekly chart, and there could subsequently be a lot of downside potential.

Nevertheless, an upward price breakout could still be worth trading because there is always the potential for the price to move back towards the 200-day exponential moving average or the 100-day exponential moving average, which currently stand at $1253.9 and $1228.3 respectively, before heading south once again.

The point is that these sideways trading ranges and inside bar formations can be very profitable to trade because in many cases the longer it remains in the range, and the longer the price trades within the initial set-up bar, the bigger the breakout once the price closes outside of this range.

To demonstrate this point, you only have to check out these two inside bar range breakouts that occurred on Bitcoin and the GBP/JPY pair last month.

Filed Under: Analysis Tagged With: breakout, gold, inside bar

AUD/USD Continues Trading In Range After False Breakout

September 24, 2018 by James Woolley Leave a Comment

Price Action in 2018

The AUD/USD hit a peak of 0.8136 back in January this year, but since then it has been in a fairly steady and consistent downward trend throughout 2018.

Indeed at the time of writing, the price of this particular currency pair is trading at 0.7273, which shows just how strong the American dollar has been this year.

AUDUSD Price Chart 2018

By drawing trendlines connecting the highs and the lows, you can see that the price has been consistently sold off at the top of the channel, and bought up each time it has traded near the bottom of the channel.

However the price did actually close strongly below this lower trendline earlier this month, suggesting that there was enough momentum to take it a low lower, but this didn’t actually turn out to be case.

False Breakout

This false breakout raises two interesting points about price action trading. First of all, not all price breakouts turn out to be profitable. Even if you have a clearly defined channel or trading range, it doesn’t necessarily follow that the price will move strongly upwards or downwards once it closes outside this range.

Secondly, it reconfirms the point that you need to be careful trading continuation patterns when the trend has already been in place for a long time already (approximately 8 months in this case). Yes there is a chance that there will be another wave downwards, but there is also a strong chance that there won’t be enough momentum to take it much lower.

With long downward trends such as this one, there is arguably more profit to be made from trading an upward price breakout because this would signify that the downward trend is over, and a new upward trend is emerging, in which case there is a lot of upside potential because it could easily move 2 or 3 times the range of the current channel.

Trading Opportunities Going Forward

At this moment in time, I wouldn’t feel comfortable going long at the bottom of the channel and going short at the top of the channel because I feel that we are due a breakout very soon.

Furthermore, I wouldn’t really want to be opening any short positions on the AUD/USD pair even if the price closed below the lower trendline once again because I’m not really confident that this pair has the potential to fall much lower.

Therefore I personally would only consider opening a long position right now, and only when the price closes strongly above the upper trendline.

If it did so, I would probably look to close half the position at the EMA (200), which is approximately 1 x the range of the channel, before moving my stop loss up to break-even and targeting 2 x the range of the channel with the second half of the position, which would give a target price of approximately 0.7700, just short of the 61.8% fibonacci retracement level.

However these are just my own personal views and in now way represents trading advice.

Filed Under: Analysis Tagged With: audusd, breakout, range trading

  • « Previous Page
  • 1
  • …
  • 4
  • 5
  • 6
  • 7
  • 8
  • 9
  • Next Page »

Forex Rebates:

Choose from 40+ different forex brokers and crypto exchanges, and get cashback every time you trade:


Copy Profitable Traders:

If you join ZuluTrade, you can follow and subscribe to profitable traders and all of their trades will be automatically copied in your own trading account.

You can also earn money as a signal provider if you are already a profitable trader.

Click here to find out more

Recommended Broker:

Recent Blog Posts:

  • High Probability Trade on S&P 500 – 26 January 2024
  • Oanda Moves Into Prop Trading With Labs Trader Program
  • My eToro Performance in 2023 – Up 33.24%
  • The5ers Offering $20K Bootcamp Challenge For Just $1
  • Example of VWAP Bounce Trade on S&P 500 – 18 December 2023

Recent Articles:

VWAP Indicator
  • MA Sabres (LuxAlgo) Indicator
  • 10 Harsh Truths About Forex Trading
  • Best Websites for Monitoring Currency Strengths
  • Xmaster Formula Indicator for MT4 and MT5
  • Tools:

    Currency Heat Map

    Categories

    • Analysis
    • News

    Archives

    • January 2024
    • December 2023
    • November 2023
    • October 2023
    • September 2023
    • August 2023
    • July 2023
    • June 2023
    • May 2023
    • August 2020
    • June 2020
    • May 2020
    • April 2020
    • January 2020
    • December 2019
    • November 2019
    • October 2019
    • September 2019
    • August 2019
    • July 2019
    • June 2019
    • May 2019
    • April 2019
    • March 2019
    • February 2019
    • January 2019
    • December 2018
    • November 2018
    • October 2018
    • September 2018
    • August 2018
    • July 2018
    • June 2018
    • May 2018
    • March 2016
    • December 2015
    • November 2015
    • October 2015
    • August 2015
    • July 2015

    Disclaimer

    This website should be used for general information purposes only and in no way represents professional financial advice.

    Forex and CFD trading carries a high level of risk and it is possible to lose more than your initial deposit if using leveraged products.

    Copyright © 2025 · eleven40 Pro Theme on Genesis Framework · WordPress · Log in

    • About
    • Contact
    • Disclosure
    • Privacy Policy
    • Terms Of Service