The Forex Chronicles

  • Rebates
  • Brokers
  • News
  • Analysis
  • Signals
    • Best Copy / Social Trading Platforms
    • eToro Review
    • FXTM Invest Review
    • Marketclub Review
    • ZuluTrade Review
  • Indicators
  • Strategies
  • Articles

Opening Range Breakout Trade on GBP/USD – 21 September 2018

September 21, 2018 by James Woolley Leave a Comment

Introduction

Opening range breakout trades can be some of the easiest and most profitable trades that you can make if you are a short-term day trader, particularly if you like to trade the main GBP and EUR pairs.

However this is not always the case. It all depends on the overnight trading range because the best set-ups will have a really narrow trading range (the smaller the better) because then there is much more potential for the price to move quite significantly when the markets open at around 8.00 AM local time.

In a perfect scenario, you will have a very small overnight trading range compared to the daily average true range (as indicated by the ATR indicator), and that’s exactly what we saw today with the GBP/USD pair.

GBP/USD Breakout Trade

It is only 9.30 AM in the UK at the time of writing this article, but the price has already moved enough to make a decent profit from this opening range breakout strategy.

GBPUSD Opening Range Breakout - 21 September 2018

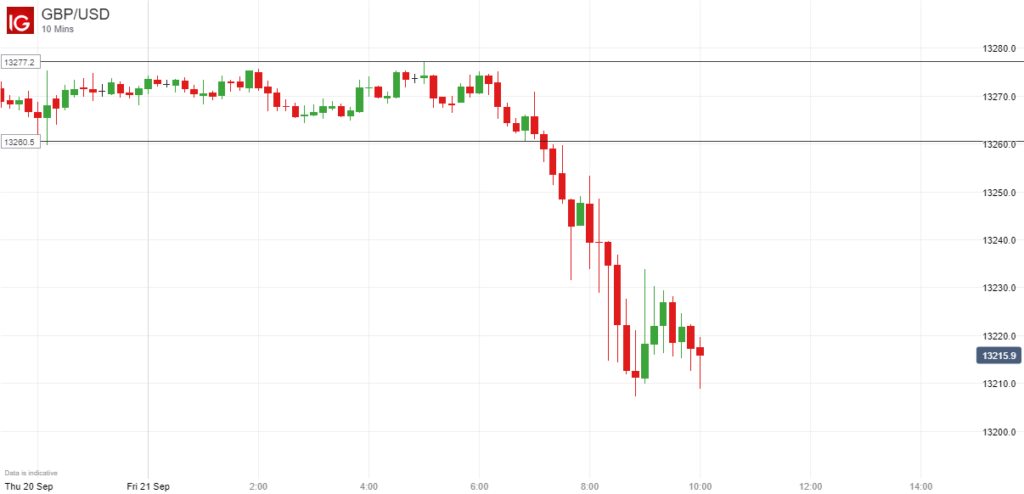
In this example the overnight trading range of the GBP/USD pair was just 16.7 points between 00.00 and 7.00 AM, which is a fraction of the average daily trading range of 92.9 points.

Therefore when the price broke downwards out of this range just after 7.00 AM, this was a good opportunity to open a short position and trade the opening range breakout.

The best strategy is often to take a small profit when it presents itself with half your position, such as 10-20 points, for example, move your stop loss to break-even and then let the other half run for as long as possible, and this would have been a profitable strategy today.

As you can see from the chart above, the price has already moved more than 50 points from the closing price of the breakout candle (which is where most breakout traders would enter a position), and we are only a few hours into the trading session.

Closing Comments

The point of this article was simply to demonstrate how profitable it can be to trade opening range breakouts.

It’s not every day that you get the perfect set-up, even if you watch many of the major currency pairs, because the price will often have moved quite a lot already in the overnight session, but if you are patient enough to wait for the ideal set-ups when the overnight range is really small, you can potentially generate some excellent profits.

Filed Under: News Tagged With: breakout, gbpusd, opening range breakout

Potential Downward Breakout on AUD/NZD Pair Below 1.0870

September 17, 2018 by James Woolley Leave a Comment

AUD/NZD Price Action

The AUD/NZD pair is one that is not widely traded or followed by British, American and European traders (who make up the majority of my readers), but it is still one that is worth watching because it can throw up some decent trading opportunities from time to time.

Having not looked at this pair for several days, I have just been looking at the recent price action, and it would appear that this pair has been slowly trending upwards in an ascending triangle pattern.

However in recent days it has been trading close to the lower trend line and is starting to show a little weakness with no real momentum to push higher.

Furthermore, the EMAs that I like to use, namely the 20, 50, 100 and 200-period exponential moving averages, are now very close to one another, which is exactly what we want to see before a big breakout.

AUDNZD Ascending Channel And EMA Breakout

Trading Opportunity

There is always the chance that the upward trend will continue and the price will move back up towards the upper trendline, but if the price does actually fall below 1.0870, it represents a much better trading opportunity in my opinion.

A downward break of the trendline, combined with an EMA breakout would be a good example of a high probability set-up and one that might be worth trading.

This is particularly true when you consider that if the price does fall below this lower trendline, it should close below the EMA (200), which the markets always pay close attention to, and will often act upon accordingly.

(Please note I am not recommending any trades. These are just my own personal thoughts and opinions).

Regarding price targets, you would have to say that if this scenario does play out, then the price of the AUD/NZD pair could easily fall to 1.0600, and if the 20, 50 and 100-period EMAs cross below the EMA (200), there could be enough momentum for the price to go a lot lower than this in the coming weeks and months.

With channel breakouts, you always want as many factors in your favour as possible, and in this case you will have the added weight of the EMAs breaking out of their consolidation and a downward cross of the EMA (200) if the price does indeed break out of its ascending channel and close below 1.0870. So this is potentially a decent set-up for anyone who is looking to take a position on this pair.

Filed Under: Analysis Tagged With: ascending channel, audnzd, breakout

Another Bitcoin Inside Bar Breakout For September 2018?

September 11, 2018 by James Woolley Leave a Comment

Previous Price Action

If you visit this site regularly, you will know from a previous post that there was a decent inside bar breakout that occurred on Bitcoin last month.

After trading in a sideways trading range for a considerable amount of time, there was an inside bar trading pattern whereby the price continued to trade within the range of the initial bar for several days, which reinforced my belief that it was only a matter of time before we saw a decent breakout, and that’s exactly what happened.

Bitcoin Inside Bar Breakout - August 2018

As I said previously, it wasn’t a perfect set-up because of the bearish breakout bar, but nevertheless you still could have generated up to 700 points profit by entering a long position at the closing price of the breakout candle.

Inside Bar Breakout Part II

If you take a look at the right hand side of the chart below to view the very latest price action, you will notice that history appears to be repeating itself.

Bitcoin Inside Bar - September 2018

After surging upwards to a high of around $7400, the price of Bitcoin has since fallen sharply and is now trading within the range of the previous inside bar.

Furthermore, we now have a new inside bar set-up because at the time of writing, the price has been trading within the range of the initial bar for the last three days.

The set-up bars are indicated by the arrows in the chart above, and you can see that the following bars / candles are all inside bars, which is often a great set-up for a significant breakout.

Trading Opportunity

As a result of this, it may be worth watching the price of this popular cryptocurrency to see if there is a good opportunity to enter a new long or short position (depending on the direction of the breakout) in the coming days.

It may be profitable to simply enter a trade when the price breaks out of the range of the initial set-up bar (and closes outside of this range), but I personally would like to see the breakout bar close outside of the range of the previous inside bar trading range as well because I think this range still carries a lot of weight and is highly significant.

Anyway I just thought I would share with you this latest inside bar set-up because the subsequent breakouts that occur can be very profitable. As always, this is not a recommendation to trade, it is just my own personal thoughts and opinions. Please be aware that cryptocurrency trading is very risky, and there is the potential to lose a lot of money.

Filed Under: Analysis Tagged With: bitcoin, breakout, inside bar

Possible EMA Channel Breakout On USD/JPY – September 2018

September 10, 2018 by James Woolley Leave a Comment

Introduction

The USD/JPY has not been the easiest pair to trade over the summer months because it has been trading in a fairly constant sideways trading range with little volatility.

Indeed the average true range is currently around 52 points per day, which is a major drop when you consider that its average daily trading range was around 90 points per day back in February.

Nevertheless the recent price action suggests that there could be a decent trading opportunity just around the corner for this particular pair.

Pre-Breakout Trading Conditions

The best breakout trades often occur when the short and long-term exponential moving averages are all very close together, and the price is trading in an ever decreasing channel, and that’s exactly what we have with the USD/JPY pair right now, as you can see from the daily chart of this pair:

USDJPY Price Chart - 10 September 2018

The channel is clearly indicated by the two trendlines, and you can see that the 20, 50, 100 and 200-day exponential moving averages are all close together as well.

This indicates a period of consolidation and indecision, but more importantly, it suggests that there could be a significant breakout very shortly.

Trading Opportunity

The price is currently trading right in the middle of this channel at around 111.00, so there isn’t an opportunity to open a position right now.

However it may be worth opening a long or a short position if the price breaks decisively out of this channel (and closes outside of this channel), at which point the price will be around 112.00 or 110.00.

As ever, there are no guarantees of success, even with the best-looking set-ups, and I am certainly not recommending any possible trades. These are just my own personal thoughts.

However what I will say is that forex trading is all about finding high probability set-ups and managing your risk so that you come out ahead over time, and this could well be a high probability trading opportunity if the trading conditions are right and the breakout appears to be a decisive one with a strong breakout candle.

Filed Under: Analysis Tagged With: breakout, channel, usdjpy

Inside Bar Breakouts On GBP/JPY And Bitcoin From Last Month

September 5, 2018 by James Woolley Leave a Comment

Introduction

As I have mentioned previously on this site, inside bar breakouts are some of the my favorite trading patterns to trade because they will often yield some excellent profits.

This is particularly true when these inside bar breakouts come towards the end of a trend because they often provide solid confirmation that a reversal is taking place.

So with that in mind, I thought I would share you two profitable inside bar breakouts that occurred last month, ie August 2018, to give you an idea of how you can potentially trade these breakouts in the future.

Bitcoin Inside Bar Breakout

The first breakout is one that I have already discussed already in a previous blog post. On this occasion I actually discussed an inside bar breakout opportunity before it occurred, when I highlighted Bitcoin’s narrow trading range.

As you can see from the chart below, the price was trading sideways for long periods of time with no clear direction, with all the inside bar candles trading within the range of the initial bar.

Bitcoin Price Chart - August 2018

This is always a good set-up for a potential breakout, and this is what subsequently happened:

Bitcoin Inside Bar Breakout - August 2018

From a trading perspective, this wasn’t a perfect set-up because the breakout candle wasn’t exactly a decisive one. It is always a better signal when the price breaks strongly upwards or downwards out of its narrow trading range, but nevertheless this is one that would still have yielded decent profits of nearly 700 points so far if you had entered at the closing price of the first breakout candle.

GBP/JPY Inside Bar Breakout

Another decent set-up from last month occurred on the daily chart of the GBP/JPY pair. This pair had fallen sharply, along with many of the other GBP pairs, and during a period of consolidation, several inside bars had started to form.

Therefore when the price closed above the initial candle, this was a good opportunity to open a new long position and trade the breakout and the reversal.

GBPJPY Inside Bar Breakout - August 2018

As you can see from the chart above, this had a much stronger breakout candle and would also have yielded some decent returns. With the momentum gathered from the positive Brexit news that was starting to emerge, the price moved around 250 points higher from the closing price of the breakout candle, and although it has since dropped back a little, it could still go higher.

Final Thoughts

It is worth mentioning that these inside bar breakouts don’t occur that often across all of the major currency pairs, but when they do occur, they can be very profitable when you get the right set-up.

I would also add that I would feel more confident trading a major currency pair, such as the GBP/JPY pair, for example, rather than a cryptocurrency such as Bitcoin simply because they are completely unregulated and have large spreads, and no-one really knows what could happen in the future. They could easily rise or fall thousands of dollars in a single day, and subsequently destroy your capital if you are not careful.

Filed Under: Analysis Tagged With: bitcoin, breakout, gbpjpy, inside bar

  • « Previous Page
  • 1
  • …
  • 5
  • 6
  • 7
  • 8
  • 9
  • Next Page »

Forex Rebates:

Choose from 40+ different forex brokers and crypto exchanges, and get cashback every time you trade:


Copy Profitable Traders:

If you join ZuluTrade, you can follow and subscribe to profitable traders and all of their trades will be automatically copied in your own trading account.

You can also earn money as a signal provider if you are already a profitable trader.

Click here to find out more

Recommended Broker:

Recent Blog Posts:

  • High Probability Trade on S&P 500 – 26 January 2024
  • Oanda Moves Into Prop Trading With Labs Trader Program
  • My eToro Performance in 2023 – Up 33.24%
  • The5ers Offering $20K Bootcamp Challenge For Just $1
  • Example of VWAP Bounce Trade on S&P 500 – 18 December 2023

Recent Articles:

VWAP Indicator
  • MA Sabres (LuxAlgo) Indicator
  • 10 Harsh Truths About Forex Trading
  • Best Websites for Monitoring Currency Strengths
  • Xmaster Formula Indicator for MT4 and MT5
  • Tools:

    Currency Heat Map

    Categories

    • Analysis
    • News

    Archives

    • January 2024
    • December 2023
    • November 2023
    • October 2023
    • September 2023
    • August 2023
    • July 2023
    • June 2023
    • May 2023
    • August 2020
    • June 2020
    • May 2020
    • April 2020
    • January 2020
    • December 2019
    • November 2019
    • October 2019
    • September 2019
    • August 2019
    • July 2019
    • June 2019
    • May 2019
    • April 2019
    • March 2019
    • February 2019
    • January 2019
    • December 2018
    • November 2018
    • October 2018
    • September 2018
    • August 2018
    • July 2018
    • June 2018
    • May 2018
    • March 2016
    • December 2015
    • November 2015
    • October 2015
    • August 2015
    • July 2015

    Disclaimer

    This website should be used for general information purposes only and in no way represents professional financial advice.

    Forex and CFD trading carries a high level of risk and it is possible to lose more than your initial deposit if using leveraged products.

    Copyright © 2025 · eleven40 Pro Theme on Genesis Framework · WordPress · Log in

    • About
    • Contact
    • Disclosure
    • Privacy Policy
    • Terms Of Service