The Forex Chronicles

  • Rebates
  • Brokers
  • News
  • Analysis
  • Signals
    • Best Copy / Social Trading Platforms
    • eToro Review
    • FXTM Invest Review
    • Marketclub Review
    • ZuluTrade Review
  • Indicators
  • Strategies
  • Articles

Possible Channel Breakout On EUR/GBP Pair For September 2018

September 1, 2018 by James Woolley Leave a Comment

Introduction

I have recently been discussing why the EUR/GBP is no longer an easy pair to trade, particularly from a day trading point of view.

I also highlighted the fact that this pair has been trading in quite a sideways trading range for a long period of time now, making it fairly difficult for long-term traders to trade as well.

All of the points raised in this article still hold true today, but that doesn’t mean that you still can’t make money trading this pair. There is still the potential to trade any breakouts when they occur, and to take advantage of any new trends that are emerging on the price chart of this pair.

Rising Channel

The EUR/GBP has indeed been trading in a sideways range if you look at the long-term price chart, but in recent months it has started to trend upwards and post new highs for 2018.

You will also notice that it has been trading within a rising channel if you draw some trendlines on the daily chart, and is now interesting to watch because the price is at a critical point at the moment.

EURGBP Rising Channel In 2018

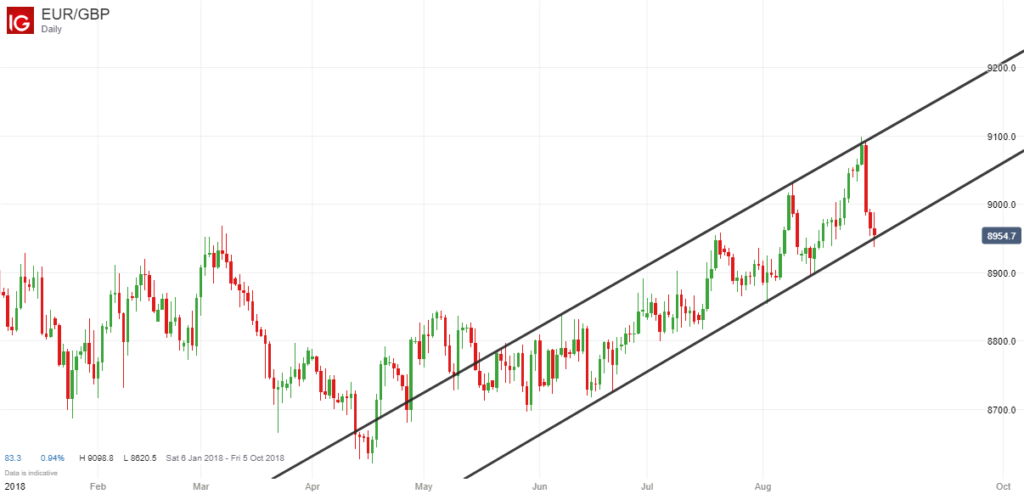
After posting a yearly high of around 0.9099, the price of the EUR/GBP pair has dropped back nearly 150 points to just over 0.8950, thanks largely to positive news regarding Brexit boosting the British Pound, and is trading right at the bottom of this rising channel, even dipping below it at one point during yesterday’s trading session.

Trading Opportunities

I have to admit that the EUR/GBP isn’t the best pair to trade breakouts with because the resulting price movements can be quite small on occasions.

Nevertheless it might be worth watching to see if the price can close decisively below this channel for an opportunity to open a short position. It may also be worth waiting for a downward breakout followed by a retracement and then a secondary price move downwards for confirmation of a breakout, although you then run the risk of missing out altogether if there is no retracement at all, which can sometimes happen.

It all depends on where the price goes from here. This lower trendline may in fact act as support once again, and subsequently push the price back up to the upper trendline, making new highs in the process.

If it does so, there is strong resistance at the top of the trendline, and further resistance at 0.9300 if the price breaks through the upper trendline because this was the high of 2017, and is also a round number that has a lot of significance in the eyes of traders.

Filed Under: Analysis Tagged With: breakout, eurgbp, rising channel

USD/CAD Symmetrical Triangle Chart Pattern For August 2018

August 21, 2018 by James Woolley Leave a Comment

Triangle Chart Patterns

It can be very useful to draw trendlines connecting the highs and the lows to see the underlying trend, and to spot any potential breakout opportunities that may be available.

Sometimes you will get ascending triangles and sometimes you will get descending triangles, but where there has been a sideways trading range, you will often see symmetrical triangles where the price is trading in an ever decreasing trading range / triangle.

This is beneficial for traders because the price has to eventually break upwards or downwards out of this triangle at some point, and when it does it often results in a strong breakout.

Symmetrical Triangle on USD/CAD Pair

You may be interested to know that there is a classic symmetrical triangle pattern on the daily chart of the USD/CAD pair right now.

USDCAD Symmetrical Triangle - August 2018

This pair has been in a slight upward trend since September 2017, but has been trading in quite a narrow sideways trading range this summer with little upward or downward momentum, which is why we now have this triangle pattern.

Potential Trade

As a result, it might be worth keeping a close eye on the daily price chart of the USD/CAD pair because it is getting very close to the lower trendline at the moment, and may be about to close below this trendline either today or in the coming days.

Therefore it could be a good time to open a new short position if the price does close strongly below this trendline because there could be a strong downward move in the following days and weeks.

As always, I am not recommending any trades. There is always the chance that any breakout could turn out to be a false one.

I am just sharing with you my thoughts and demonstrating how you can trade any breakouts that occur when the price breaks out of a symmetrical triangle pattern.

Filed Under: Analysis Tagged With: breakout, symmetrical triangle, usdcad

Potential Inside Bar Breakout On Bitcoin For August 2018

August 20, 2018 by James Woolley Leave a Comment

Trading Bitcoin

After the European Securities and Markets Authority increased cryptocurrency margin rates to 50%, it has obviously become a lot more expensive to trade Bitcoin and other cryptocurrencies, and a lot less appealing.

The spreads can also be quite off-putting as well because even if your broker does offer Bitcoin trading, you may need the price to move 50-200 points (or more) just to break even.

Nevertheless those that do have enough capital in their trading accounts can still potentially benefit from some big price swings because this is still quite a volatile market to trade, and when the price does start moving, it can easily move upwards of 1000-2000 points in just a few days.

Inside Bar Breakout

Many people are sceptical about treating these cryptocurrencies the same as any other market, and using the same kind of technical analysis to find profitable trading opportunities, but based on previous price action, it does seem to be very profitable to trade any breakouts that occur.

That’s why I wanted to highlight the current price action because the price of Bitcoin has been trading in a sideways range just recently, and more significantly, the last 5 daily candles are all inside bars, ie the last 5 candles are all within the high and low of the large candle from 15 August (indicated by the arrows), which had a daily range of around 500 points.

Bitcoin Price Chart 20 August 2018

How To Trade

A lot of traders have their own personal inside bar and breakout strategies that they like to use, but I myself like to enter a new position when the price moves above the high or below the low of the initial candle and CLOSES above or below this candle.

In my experience, you don’t want the breakout candle to be too large, but you don’t really want the breakout candle to be one that has a small trading range either because this could be a false breakout.

Anyway I just wanted to share my thoughts on the latest Bitcoin trading action, and explain how I like to trade these breakouts when they occur.

Whether the price moves strongly higher or strongly lower after the price closes above the initial candle remains to be seen, but it will be interesting to watch what happens regardless because the price has barely moved in the last few weeks.

An upward breakout could see the price test its recent highs of around $8500, whilst a downward breakout could potentially see the price collapse if it breaches its recent low of $5887 from last week and its previous low of $5769 from June.

Please note I am not offering any advice or recommending any trades. You should always do your own research and make your own decisions before entering a position.

Filed Under: Analysis Tagged With: bitcoin, breakout, inside bar

EUR/USD Trading Update For August 2018

August 14, 2018 by James Woolley Leave a Comment

Previous Analysis From Last Month

A few weeks ago I wrote this blog post discussing the low volatility of the EUR/USD pair, and showed how it was trading in an ever decreasing channel.

When you get a tightening trading range and low volatility with the exponential moving averages and bollinger bands all tightly packed together, you often get a strong breakout in one direction or the other when the price breaks out of this channel, and this is exactly what happened.

Downward Breakout During August

EURUSD August Breakout

At the start of this month, the price finally broke downwards out of this channel (and below the outer bollinger band), closing the day at 1.1586, which we highlighted at the time on our Twitter page and our new Instagram page.

The price then continued falling during the following three trading sessions, before bouncing back for a few days. However you will see that the previous trendline acted as resistance and traders used this resistance level to open new short positions and drive the price downwards again. So there was another opportunity to go short if you missed the initial breakout.

Subsequently, if you had opened a short position at the close of the initial breakout candle, you could have yielded over 200 points so far (if you had placed your stop loss above the trendline or above the high of the breakout candle, for example), and this downwards breakout could yet yield a lot more points.

Profitability of Channel Breakouts

Whether you took this particular trade or not, I just wanted to highlight how profitable these breakout trades can be if you are patient enough to wait until a clear breakout has occurred.

Yes it can be frustrating when one of your favorite pairs is trading in a narrow trading range because the short-term moves are hard to make money from, but if you switch your attention to the daily charts, you can see some large moves on occasions, and this is one example.

Filed Under: Analysis Tagged With: breakout, eurusd

EUR/USD Trading Update For July 2018

July 31, 2018 by James Woolley Leave a Comment

Lower Volatility in Summer

All of the major currency pairs tend to see a large reduction in volatility during the summer months, with smaller price moves every day, and the EUR/USD pair is no exception.

If you look at the average true range of this particular pair (using the ATR indicator), you will see that it has dropped to around 65 points right now at the end of July 2018, which makes it fairly hard to trade for any short-term traders.

Narrow Price Range

As well as having small price moves, it has also been trading in a narrow, sideways price range with no clear direction.

The 20, 50 and 100-day EMAs are all very close together and the Bollinger Bands are also very narrow, which helps to confirm this narrow trading range.

More importantly, if you draw two trendlines joining the highs and lows of the recent trading range, as shown in bold in the price chart below, you can see that the price is trading is an ever decreasing trading range, which is often the pre-cursor to a major breakout.

EURUSD 31 July 2018

Potential Trading Opportunity

Subsequently, this represents a possible trading opportunity because if the price breaks strongly upwards or downwards (and closes outside this range and outside the Bollinger Bands on the daily chart), this is potentially a good time to open a new position and capitalize from this breakout.

(Disclaimer: These are just my own thoughts and ideas, and it doesn’t represent financial advice in any way. Please do your own research before opening any positions.)

A Word of Warning

Trades like these are often very profitable because everything is in place for a strong breakout (narrow EMAs, narrow Bollinger Bands, trading within trendlines, etc), but you have to be careful during the summer months because volumes are lower and sometimes these breakouts don’t have the momentum to be sustained for very long.

It will be interesting to see what happens anyway because the price has to break out of this ever decreasing price range very soon, and so there could potentially be a big move upwards or downwards in the coming weeks if there is some momentum behind this breakout.

Filed Under: Analysis Tagged With: breakout, eurusd

  • « Previous Page
  • 1
  • …
  • 6
  • 7
  • 8
  • 9
  • Next Page »

Forex Rebates:

Choose from 40+ different forex brokers and crypto exchanges, and get cashback every time you trade:


Copy Profitable Traders:

If you join ZuluTrade, you can follow and subscribe to profitable traders and all of their trades will be automatically copied in your own trading account.

You can also earn money as a signal provider if you are already a profitable trader.

Click here to find out more

Recommended Broker:

Recent Blog Posts:

  • High Probability Trade on S&P 500 – 26 January 2024
  • Oanda Moves Into Prop Trading With Labs Trader Program
  • My eToro Performance in 2023 – Up 33.24%
  • The5ers Offering $20K Bootcamp Challenge For Just $1
  • Example of VWAP Bounce Trade on S&P 500 – 18 December 2023

Recent Articles:

VWAP Indicator
  • MA Sabres (LuxAlgo) Indicator
  • 10 Harsh Truths About Forex Trading
  • Best Websites for Monitoring Currency Strengths
  • Xmaster Formula Indicator for MT4 and MT5
  • Tools:

    Currency Heat Map

    Categories

    • Analysis
    • News

    Archives

    • January 2024
    • December 2023
    • November 2023
    • October 2023
    • September 2023
    • August 2023
    • July 2023
    • June 2023
    • May 2023
    • August 2020
    • June 2020
    • May 2020
    • April 2020
    • January 2020
    • December 2019
    • November 2019
    • October 2019
    • September 2019
    • August 2019
    • July 2019
    • June 2019
    • May 2019
    • April 2019
    • March 2019
    • February 2019
    • January 2019
    • December 2018
    • November 2018
    • October 2018
    • September 2018
    • August 2018
    • July 2018
    • June 2018
    • May 2018
    • March 2016
    • December 2015
    • November 2015
    • October 2015
    • August 2015
    • July 2015

    Disclaimer

    This website should be used for general information purposes only and in no way represents professional financial advice.

    Forex and CFD trading carries a high level of risk and it is possible to lose more than your initial deposit if using leveraged products.

    Copyright © 2025 · eleven40 Pro Theme on Genesis Framework · WordPress · Log in

    • About
    • Contact
    • Disclosure
    • Privacy Policy
    • Terms Of Service