September Price Action
It has been very interesting to watch the price of Brent Crude this month because it has been getting very close to the $80 level without actually breaking through this key level.
I said before that $80 is acting as strong resistance, and the third significant doji candle from yesterday provides further evidence that the market just doesn’t want to see the price go higher than $80.
In that particular trading session, the price reached a high of $79.69 before being driven back down to a low of $77.81. It then closed the day close to it’s opening price at $78.23, which is why we have another doji candle.
The Significance of Doji Candles
These doji candles generally indicate indecision in the markets, but when they occur at a possible high or low of a trading range and are close to key levels of support and resistance, they often provide good reversal signals, and that seems to be the case here.
Every time there has been a doji candle forming after a flirtation with the $80 level, the price has subsequently dropped and there has been a good opportunity to trade the downward breakout, ie when the price drops below the low of the doji candle the following day.
On each occasion the price has dropped enough to generate a decent profit before resuming it’s gradual upward trend once again, but there are signs that this upward trend is starting to run out of momentum.
RSI and Stochastic Divergence
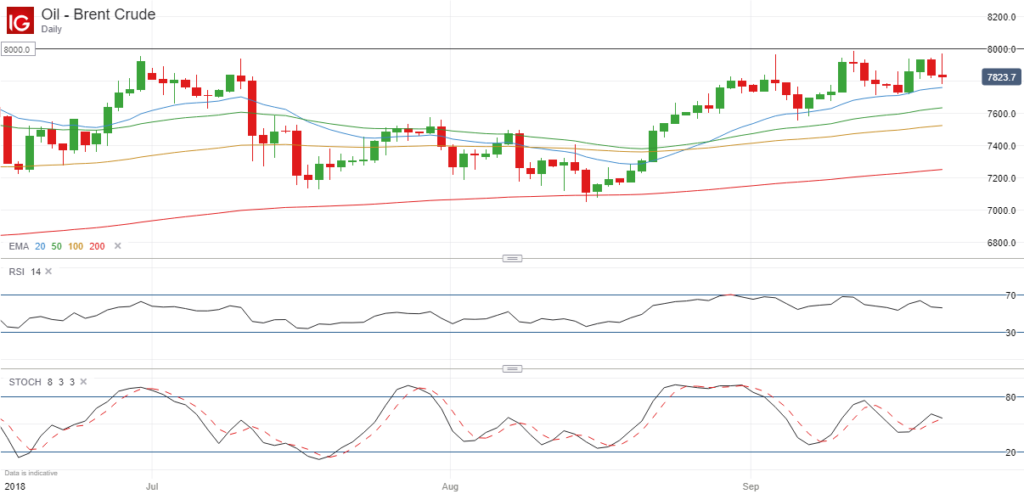
As you can see from the daily chart of Brent Crude above, the price keeps on creeping higher, as indicated by the rising exponential moving averages, but the RSI and stochastic indicators are struggling to make new highs. In fact the peaks are actually getting lower each time.
So there is clear divergence on both of these indicators, which suggests that momentum is running out and as a result of this, there could be a significant reversal just around the corner. Therefore the 200-day exponential moving average, which currently stands at $72.51, may be a realistic target.
Trading Ideas
I will be watching the price of Brent Crude very closely when the markets open on Monday because it will be interesting to see where the price goes from here. There are potentially two scenarios that could create a high probability set-up:
- The price drops below the low of the doji candle ($77.81), in which case it may be worth opening a short position a few pips below this level.
- There is an inside bar whereby the trading range of the entire day (and maybe a few subsequent days) falls within the high and low of the doji, in which case it might be an idea to watch and wait until the price breaks below the low of the doji candle for an opportunity to go short.
If the price goes higher and breaks above the high of the doji candle, then it may finally breach the $80 level, in which case it might be worth opening a long position or forgetting about opening any trades altogether.
With divergence on the RSI and stochastic indicators, as well as a nice doji candle near the $80 level, a short position is looking a lot more appealing at the present time.
As always, I just want to point out that these are just my own thoughts and opinions. I am not recommending any trades whatsoever. You should always do your own research and make your own decisions when trading the financial markets.