The Forex Chronicles

  • Rebates
  • Brokers
  • News
  • Analysis
  • Signals
    • Best Copy / Social Trading Platforms
    • eToro Review
    • FXTM Invest Review
    • Marketclub Review
    • ZuluTrade Review
  • Indicators
  • Strategies
  • Articles

FTSE and Dow Jones Continue to Trade Sideways in March 2019

March 14, 2019 by James Woolley Leave a Comment

Introduction

As someone who trades both UK and US stocks on the eToro platform (profile = SteadyProfits), I am all too aware of how little movement there has been just recently on the major UK and US stock markets.

If you look at the daily chart of the FTSE 100 index below, you will see that it appears to have stabilized in the 7100s, having continuously traded between 7100 and 7200, and there is no real momentum to take it higher or lower at the current time.

FTSE 100 Chart - 14 March 2019

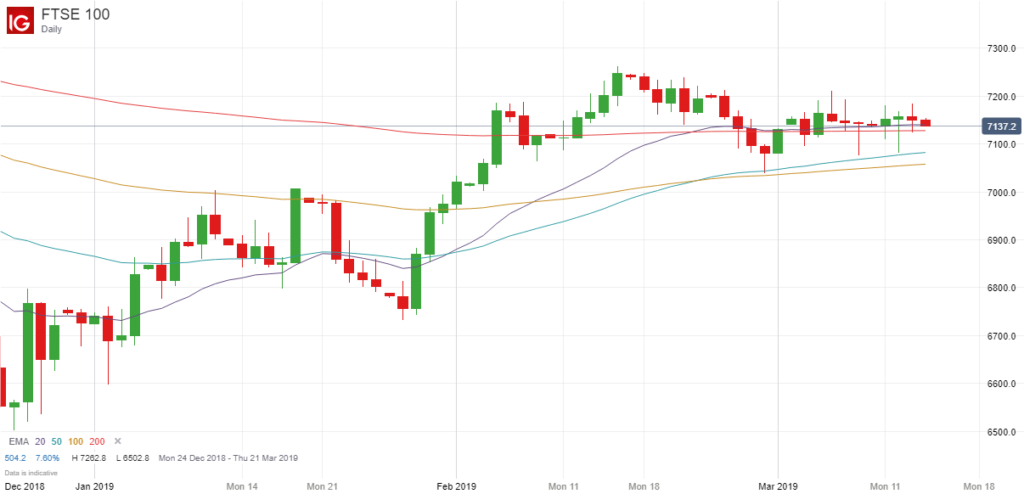
Indeed the last time it closed outside of this 100-point trading range was as long ago as 1 March. The price just doesn’t seem to want to move away from the 100 or 200-day moving average at the moment.

This is almost certainly due to all of the uncertainty surrounding Brexit because the markets are waiting to see what will happen on 29 March. The threat of a no-deal Brexit appears to be receding, with an extension almost inevitable, but there is the growing threat of a second referendum, which could result in Brexit being cancelled altogether.

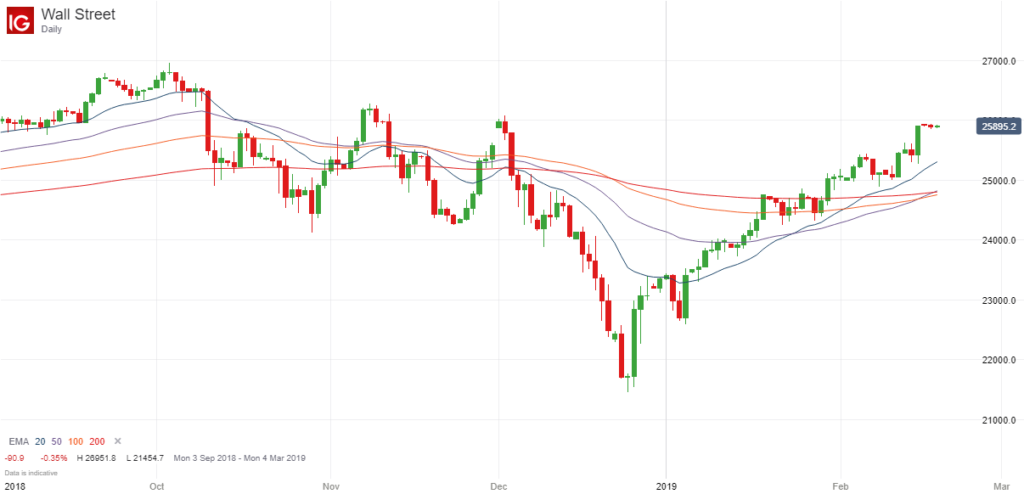
However it is not just the UK market that has been trading in a sideways trading range this month because the Dow Jones has also been trading sideways with no real direction, as you can see below:

Dow Jones Chart - 14 March 2019

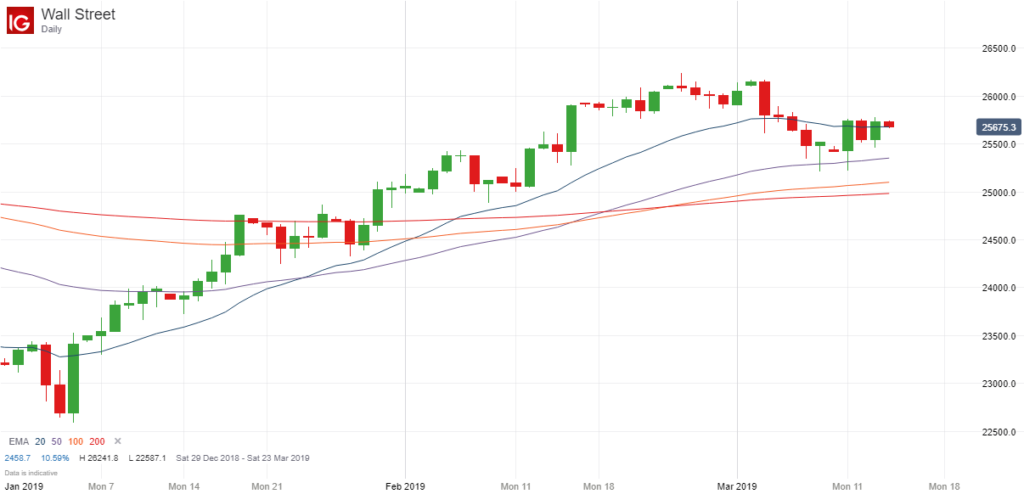
After bouncing back from its December lows, the price has risen above its long-term moving averages, ie the 100 and 200-day EMA, and is trading just below its highs from last month at around 25,700.

Trading Opportunity

So what does all this mean from a trading point of view?

Well at the moment it is hard to enter any trades with any real confidence, and if these two markets were to test their highs again, it would be hard to justify a major breakout to the upside at the moment with everything that is going on with Brexit and China.

Indeed even if there was some clarity with regards to Brexit, it would still be hard to predict how the FTSE 100 is going to react to this news. That’s because even though it would be natural to assume the FTSE 100 index would move strongly upwards if Brexit was delayed or even cancelled, the strengthening of the £ could actually cause the index to fall because many of the largest FTSE 100 companies report their earnings in US dollars, which would obviously be weaker.

So I think it is better to wait for any news first of all, and then wait for a decisive breakout. As I said, I wouldn’t necessarily be confident about trading an upward breakout, but if the price were to fall below the long-term moving averages with a downward moving average crossover, there could potentially be a lot of potential downside, and this would probably be a higher probability trading opportunity.

Anyway these are just my own thoughts and opinions. As always, this does not represent professional trading or financial advice. You should always do your own research before entering any trades.

Filed Under: News Tagged With: dow jones, ftse 100

Gold, Oil and Stock Markets All Looking Strong – February 2019

February 19, 2019 by James Woolley Leave a Comment

Markets Summary

It has been very interesting to see how the markets have traded in the first few months of 2019, and I think it is fair to say that many people will have been surprised by just how high they have gone.

After crashing in November and December to panic-inducing lows, the Dow Jones has staged a remarkable turnaround, and is now just over 1000 points off its all time high at the time of writing.

Dow Jones Daily Chart - 19 February 2019

It wasn’t long ago that the Dow Jones was trading as low as 21,500, and everyone was predicting it would go much lower, but it is currently up to 25,890 and the strong upward trend is showing no signs that it is potentially coming to an end.

The same can be said for the FTSE 100. It was trading between 6600 and 6800 for quite a long time towards the end of last year, and some experts were predicting that it would fall to around 6000, but it is now trading above 7200, and could continue to edge higher throughout 2019.

Normally with such strong stock markets around the world, you might expect that the price of gold would have dropped because people naturally tend to sell some of their gold and invest the proceeds into stocks when the markets are rising. However this hasn’t happened at all, and the price of gold has actually risen strongly above the previous resistance level of $1300.

Finally, there is one other market that has risen strongly in recent weeks, and that’s the oil market. The price of both Brent crude and US crude oil has risen sharply, and they currently stand at $66.60 and $56.45 respectively.

Time To Short These Markets?

The question many traders are now asking themselves is; is this a good time to open short positions on some of these markets?

My own view is that all of these markets are now looking seriously overbought according to many different indicators, but that doesn’t necessarily mean that this is a good time to go short.

They were also looking overbought one week ago, and indeed two weeks ago, for example, but have still continued to move higher.

Closing Comments

The point I really want to get across is that trying to call the top of a strong rising market is a very dangerous game. Yes you may get lucky at times when all your technical indicators seem to suggest that it is set to reverse, but the price can easily continue to go higher and potentially take out your stop loss if you are not careful.

I myself have been wrong with some of my predictions on this blog because I thought the Dow Jones and US crude would both run into resistance and move lower, but the price of both of these markets just went straight through these resistance levels.

So it is often a much better strategy to find a strategy that trades in the same direction as the prevailing trend when the markets are rising so strongly. Of course these markets can’t keep on rising forever and there will eventually be a reversal, but trying to predict when this will occur is never easy.

Filed Under: Analysis Tagged With: dow jones, gold, oil

Dow Jones and Gold Trading Close to Major Resistance Levels

January 18, 2019 by James Woolley Leave a Comment

Previous Analysis

I have been looking at the price of both gold and the Dow Jones index in recent weeks because they have both been trading close to major resistance levels, and are therefore potentially worth shorting.

Since I wrote these two blog posts, nothing much as changed, particularly in the case of gold, but the Dow Jones has continued to move higher, and is now very close to the major resistance levels that I highlighted previously.

So I thought it would be a good idea to take another look at these two markets and make a prediction as to where they might be headed.

Please note that these are only my own personal opinions and do not in any way represent financial or trading advice of any kind.

Gold

I mentioned before that $1300 is acting as a major resistance level at the moment, and that still seems to be the case today:

Gold Price Chart - 18 January

At that time it was trading at $1283, but as you can see from the chart above, the price has slowly edged higher towards the $1300 level since then.

Nevertheless, it has once again stalled in the $1290s as the general stock markets have continued to rise, and as you can see from the chart above, the price has been trading in an ever decreasing triangle.

Therefore I personally think that it is only a matter of time before we see a breakout, and the likelihood is that it will be a downward one because of the continual round number resistance at $1300 and the tight price action.

So it wouldn’t be at all surprising if the price were to move back to around $1250-$1260, towards the 100 and 200-day moving averages, but if the price was to go back to $1300, it may also be worth opening a short here because I think this would be a fairly high probability set-up as well.

Dow Jones

As mentioned earlier, the Dow Jones has continued to recover from its December lows, and this isn’t really that surprising.

I said in a previous post that the price could easily continue moving higher and test its long-term moving averages, which at that time stood at 24,507 (EMA (100)) and 24,741 (EMA (200)), and at the time of writing, the price is now trading at 24,406 pre-market opening.

Dow Jones Chart - 18 January

Indeed it has just touched the EMA (100) yesterday and today, having risen sharply from a low of 21,454, so it is now looking seriously overbought and could now be ready to turn lower now that it has reached two major resistance levels (the EMA (200) is just 280 points higher).

As always, the market never gives you a clear signal that a top or a bottom has been reached, but with the price trading close to two key moving averages, I think it could be a good opportunity to open a short position if we get a pin bar on the daily chart or one of the lower time frames, for example, because this would also be a high probability set-up.

Filed Under: Analysis Tagged With: dow jones, gold, resistance

Dow Jones Analysis For January 2018 – How High Can It Go?

January 9, 2019 by James Woolley Leave a Comment

December Price Crash

Unless you have been living under a rock for the last few months, you will know that the Dow Jones (and all of the other major indices) completely collapsed last month, continuing on from the initial negativity in November.

The much anticipated Santa rally never really materialised in these panic-driven conditions, and many people will have spent Christmas looking at their depleted portfolios and seeing how much money they have lost on paper.

Despite all this, the markets have staged a recovery after we saw trade war tensions ease and received some positive assurances from the Fed, and they are now significantly higher than their previous lows.

I can certainly vouch for this because my new trading account on eToro (which you can follow or copy by searching for SteadyProfits on eToro) that I was unfortunate enough to open just before the crash, has recovered much of its losses in recent weeks.

The question that many people will be asking now is; how much higher can the Dow Jones go?

Future Price Move

I am not foolish enough to believe that all of the bad news is behind us. There is still a lot of uncertainty surrounding Brexit, there is a possible recession looming in Germany, and tech giants such as Samsung and Apple have warned that profits will be lower than forecast this quarter.

Therefore there could still be another downward wave of selling just around the corner. However as I discussed in yesterday’s post regarding the future gold price, there is still the potential for the markets to continue going a little higher in the near future.

Dow Jones Chart - 9 January 2018

Price Targets / Trading Opportunity

If it does continue to move higher, then the 100 and 200-day exponential moving averages are obvious targets because these are not much higher than today’s price, and are now within range.

The price has already breached the 200-period EMA on the 4-hour chart, but on the daily price chart shown above, it hasn’t even hit the 50-period EMA yet. So there is the potential for the price to move higher and test these key levels, which currently stand at:

  • EMA (100) = 24,507
  • EMA (200) = 24,741

With the price currently standing at 23,820, this represents a potential gain of at least 687 points, or 2.88%.

If it does hit the 100 or 200-day exponential moving average, the markets are likely to see this as a strong resistance level, and I wouldn’t be surprised if this was the start of a new downward price move.

Therefore in terms of a trading opportunity, I would probably be looking for a key reversal signal, such as a pin bar, for example, or divergence on a few key indicators before opening a short position around these key resistance levels.

However these are just my own thoughts and opinions, and it doesn’t represent professional financial or trading advice in any way.

Filed Under: Analysis Tagged With: dow jones

Dow Jones Analysis – Positive Divergence Hints at Santa Rally

December 19, 2018 by James Woolley Leave a Comment

December Price Falls

December is usually quite a good month for stock market traders and investors, but this has apparently been the 2nd worst December on record.

The leading stock market indices have all fallen sharply and there are many reasons why. Brexit, interest rate rises, trade tariffs and the threat of a possible recession have all weighed heavily on the indexes this month.

As a result of this, many people have given up on the idea that there will be a Santa rally this year, but looking at the 4-hour chart of the Dow Jones, there is still hope:

Dow Jones Positive Divergence - December 2018

Positive Divergence

As you can see, the price has recently been posting new lows, but if you look at three of the leading technical indicators, you will notice that there has been positive divergence on each of these indicators.

In other words, as the price has posted new lows, the CCI, RSI and Stochastics indicators have all failed to post new lows, and have actually been trading higher, which suggests that the downward move is running out of momentum.

Future Price Move

This positive divergence suggests that the price is likely to move higher in the coming days, but it should always be emphasized that these are all just indicators. The price could easily turn lower and start a new downward wave.

However with just 4 trading sessions left before Christmas, my own view is that we will still see a Santa rally this year, which could then continue until the New Year, as it so often does.

Therefore a price of 24,000 would be my first target, which should easily be achieved if there is such a rally, and looking further ahead, I wouldn’t be surprised it the price went back to the EMA (100) on this time frame, which is currently around 24,500. This would result in a rise of around 3% from the current price level.

As always, these are just my own thoughts and predictions. This in no way represents professional trading or financial advice. You should always do your own research before entering any positions in the markets.

Filed Under: Analysis Tagged With: divergence, dow jones, santa rally

  • 1
  • 2
  • Next Page »

Forex Rebates:

Choose from 40+ different forex brokers and crypto exchanges, and get cashback every time you trade:


Copy Profitable Traders:

If you join ZuluTrade, you can follow and subscribe to profitable traders and all of their trades will be automatically copied in your own trading account.

You can also earn money as a signal provider if you are already a profitable trader.

Click here to find out more

Recommended Broker:

Recent Blog Posts:

  • High Probability Trade on S&P 500 – 26 January 2024
  • Oanda Moves Into Prop Trading With Labs Trader Program
  • My eToro Performance in 2023 – Up 33.24%
  • The5ers Offering $20K Bootcamp Challenge For Just $1
  • Example of VWAP Bounce Trade on S&P 500 – 18 December 2023

Recent Articles:

VWAP Indicator
  • MA Sabres (LuxAlgo) Indicator
  • 10 Harsh Truths About Forex Trading
  • Best Websites for Monitoring Currency Strengths
  • Xmaster Formula Indicator for MT4 and MT5
  • Tools:

    Currency Heat Map

    Categories

    • Analysis
    • News

    Archives

    • January 2024
    • December 2023
    • November 2023
    • October 2023
    • September 2023
    • August 2023
    • July 2023
    • June 2023
    • May 2023
    • August 2020
    • June 2020
    • May 2020
    • April 2020
    • January 2020
    • December 2019
    • November 2019
    • October 2019
    • September 2019
    • August 2019
    • July 2019
    • June 2019
    • May 2019
    • April 2019
    • March 2019
    • February 2019
    • January 2019
    • December 2018
    • November 2018
    • October 2018
    • September 2018
    • August 2018
    • July 2018
    • June 2018
    • May 2018
    • March 2016
    • December 2015
    • November 2015
    • October 2015
    • August 2015
    • July 2015

    Disclaimer

    This website should be used for general information purposes only and in no way represents professional financial advice.

    Forex and CFD trading carries a high level of risk and it is possible to lose more than your initial deposit if using leveraged products.

    Copyright © 2025 · eleven40 Pro Theme on Genesis Framework · WordPress · Log in

    • About
    • Contact
    • Disclosure
    • Privacy Policy
    • Terms Of Service