The Forex Chronicles

  • Rebates
  • Brokers
  • News
  • Analysis
  • Signals
    • Best Copy / Social Trading Platforms
    • eToro Review
    • FXTM Invest Review
    • Marketclub Review
    • ZuluTrade Review
  • Indicators
  • Strategies
  • Articles

Dow Jones Trading in Symmetrical Triangle Heading into Thanksgiving

November 20, 2018 by James Woolley Leave a Comment

Price Action

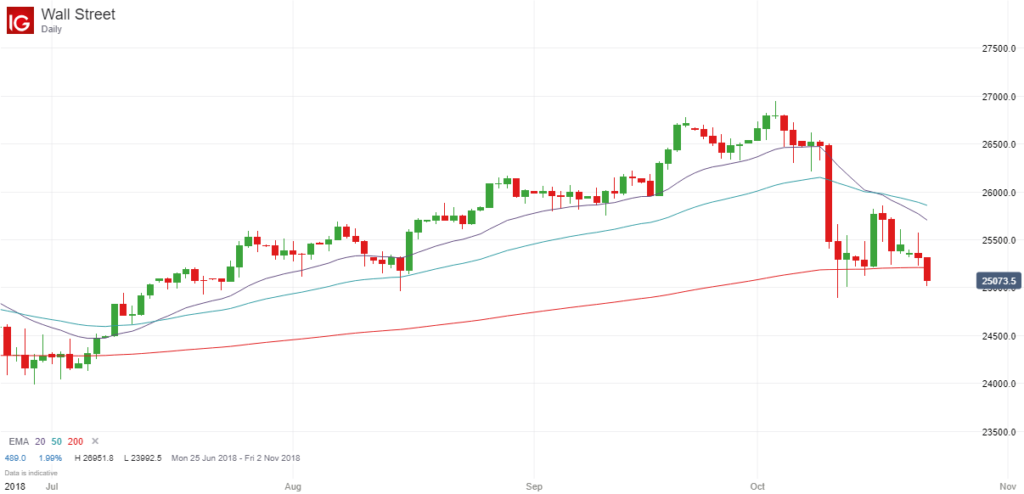
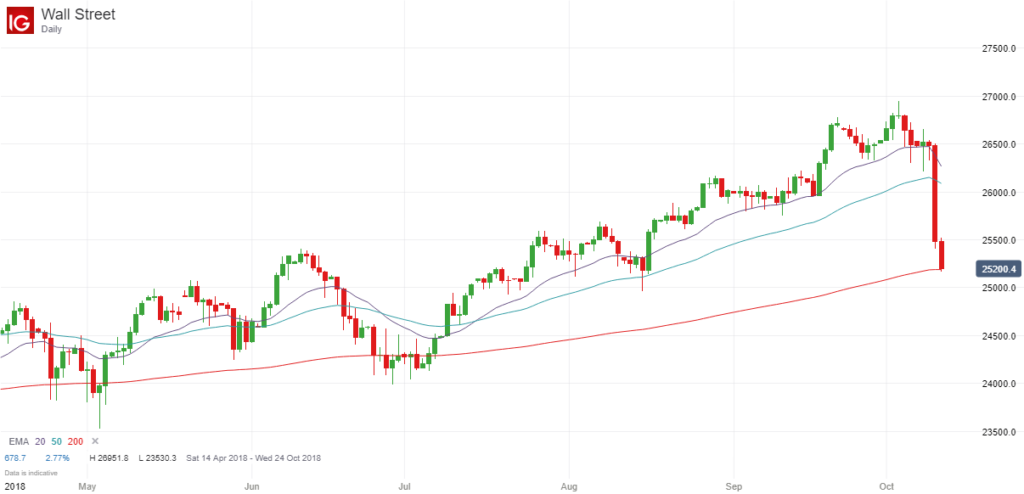
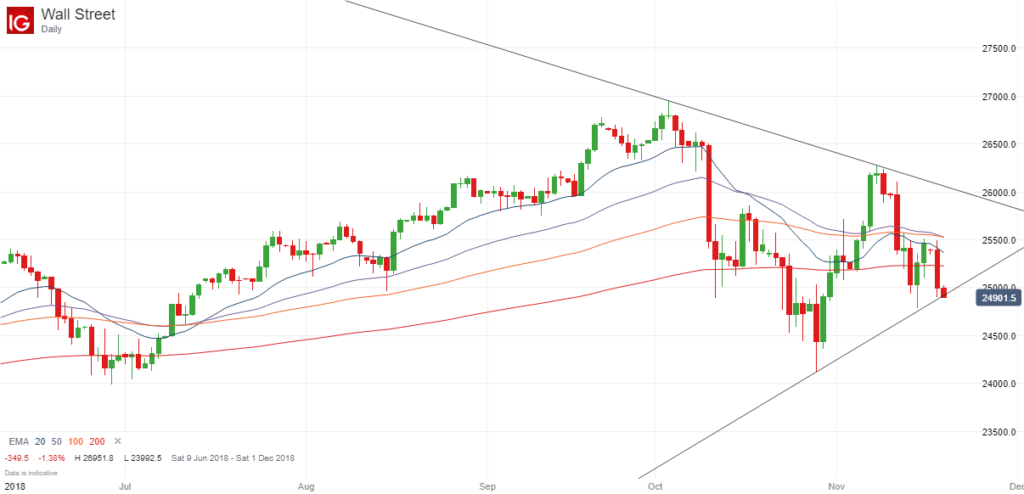
The markets have been fairly turbulent in recent weeks. After a big sell-off that took the Dow Jones all the way down to 24,120, the markets bounced back and the Dow went on to hit a high of 26,278.

However despite this temporary strength, I think many traders and investors were wary that this may be a dead cat bounce and further weakness may be just around the corner, and this has proven to be the case so far because the Dow has since fallen back to 24,902 at the time of writing (based on the future price pre-opening).

Dow Jones Symmetrical Triangle - November 2018

Symmetrical Triangle and EMA Convergence

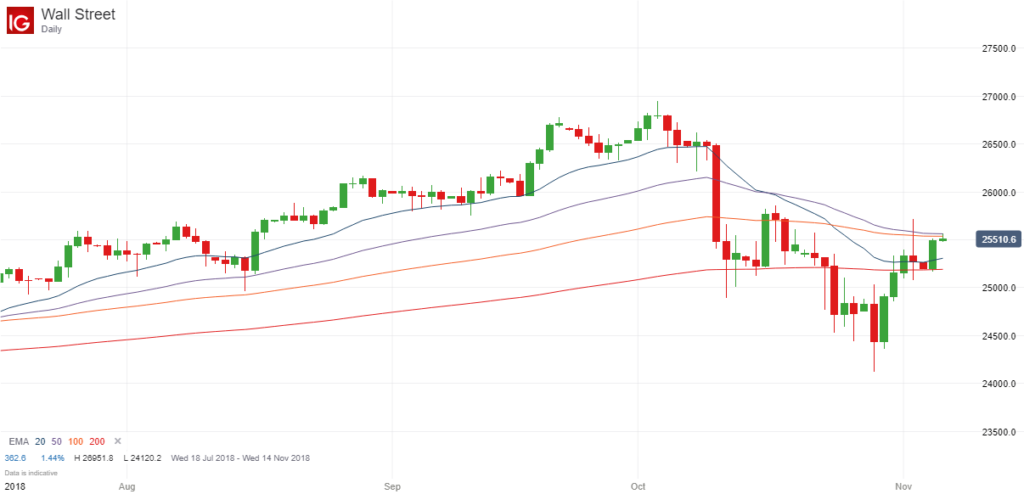
If you take a look at the daily price chart of the Dow Jones above, you can see that the price has been trading in a symmetrical triangle if you draw some trendlines connecting the highs and the lows of the recent price action.

Furthermore, you can also see that the EMAs that I like to use, ie the 20, 50, 100 and 200-period EMAs, have all converged and are tightly packed together.

Both of these chart patterns generally point to a possible breakout when they occur together, and with the symmetrical triangle getting smaller and smaller every day, a breakout is looking highly likely right now.

Trading Opportunity

At the moment the price is trading very close to the bottom of the triangle, and is therefore very close to breaking below the lower trendline and breaking out to the downside.

However it is still unclear whether the price is actually going to break below this trendline or whether it will find support at this level.

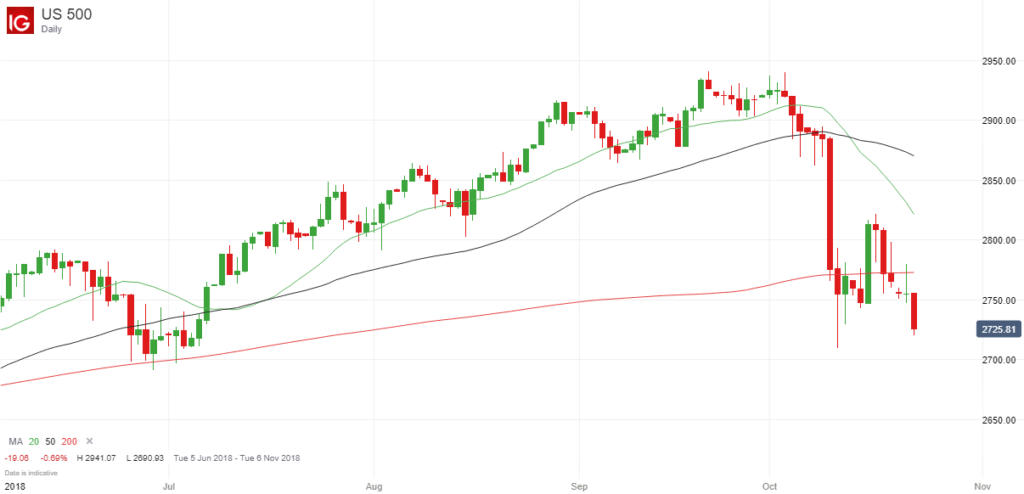
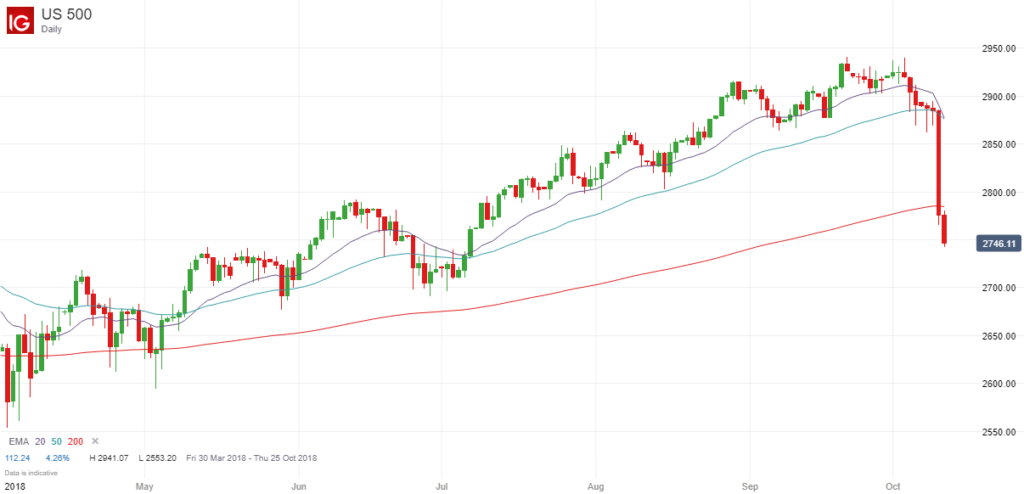
You would normally expect the price to continue falling, but we are now in Thanksgiving week, which is usually a very good week for the major stock markets, with the S&P 500 higher 75% of the time since 1945, for example.

So any downward breakout may be curtailed by a short-term rally during the remainder of Thanksgiving week, and with Christmas just around the corner, there could well be a Santa rally to look forward to in about a month’s time.

Therefore while this would ordinarily be a possible breakout opportunity, you have to be very careful if you are tempted to sell any downward breakout. Indeed I wouldn’t be at all surprised if the upper trendline is breached in the coming weeks.

Filed Under: Analysis Tagged With: breakout, dow jones

Why Today Could Be A Significant Day For The Dow Jones And S&P 500

November 6, 2018 by James Woolley Leave a Comment

Introduction

After last month’s heavy stock market falls, the markets have bounced back as people have seen this as a good opportunity to pick up some cheap stocks.

As a result, the price of both the Dow Jones and S&P 500 has moved back upwards towards the 200-day exponential moving average, and above it in the case of the Dow Jones.

However even though we have seen a small rally of sorts, the markets are delicately poised right now and could yet go a lot lower.

Looking at the daily price charts of both indexes, I think today could well be a decisive day for the markets, and could potentially determine the future direction in the coming weeks. Let me explain why.

Pin Bar and Inside Bars

Dow Jones Daily Chart - 6 November 2018

Last Friday we had a significant pin bar on both of these markets whereby the price moved a lot higher during the trading session but ultimately fell back downwards and closed close to where it opened.

This is important because it indicates that there wasn’t the momentum to drive it higher (and stay higher), and indicates that there is still a lot of uncertainty in the markets.

To confirm this point, there was an inside bar yesterday where the price traded within the range of this pin bar on both the Dow Jones and the S&P 500, which once again highlights a degree of uncertainty.

Finally, it is worth noting that the 20, 50, 100 and 200-period exponential moving averages have all converged in recent days and are now trading very close to each other, which often occurs before a significant breakout.

Future Price Direction

At this point in time it is absolutely impossible to predict which way the markets are going to go. However I think this is going to be an important trading session today because if the price of the Dow Jones or the S&P 500 closes above or below the range of last Friday’s pin bar, it could be the start of a massive breakout.

If this occurs, we could see the markets move hundreds of points upwards or downwards in either direction.

It could be the start of a new bullish recovery, which could continue right through until after Christmas because this is nearly always a good period for the stock markets, or alternatively it could be a continuation of last month’s falls and there may not even be any kind of Christmas rally this year.

For purely selfish reasons, I would prefer an upward breakout because this would have a positive knock-on effect on my UK stock portfolio, but I still have some cash on the sidelines ready and waiting to pick up some bargains if the markets move a lot lower.

Either way, it should be interesting to watch the price action today, and see if the price can close significantly outside of the range of this pin bar on both markets.

Filed Under: News Tagged With: dow jones, inside bar, pin bar, s&p500

Bearish Signals For US Stock Markets – October 2018

October 23, 2018 by James Woolley Leave a Comment

Previous Price Action

I think many traders were shocked by the severity of the mini-crash that occurred recently on the US stock markets because it seemed to come out of nowhere, even though many traders and investors have been expecting some kind of pull-back for quite a while now.

Since then there hasn’t really been a continuation of the sell-off because the price seems to have consolidated around the 200-day exponential moving average of both the S&P 500 and the Dow Jones.

However after a brief reversal, it is clear that there is not enough momentum to take it back to its previous highs, and worse still, the price action of the previous two trading sessions paints a bleak picture.

On both occasions the price traded a lot higher during the day, but ended up falling back and closing close to its opening price, which is a very bearish sign.

Furthermore, the futures prices of both of these markets are currently suggesting that the price is set to open a lot lower later today.

S&P 500 Price Weakness - October 2018

Dow Jones Price Weakness - October 2018

Future Direction

It is generally a bad idea to make predictions, particularly if you are backing your predictions with your own money, but the signs are not good if you are hoping for a recovery.

The two bearish pin bars and what is looking like a significantly lower opening later today is going to take the price further away from the EMA (200), and we have already seen the EMA (20) cross below the EMA (50), which is obviously another bearish signal.

I think the key thing to look for here is to see if the price can break below the previous lows on both the S&P 500 and the Dow Jones, which currently stand at 2709 and 24896 respectively.

If this happens, and the price actually closes below these lows, then there is a high probability that the price will go a lot lower.

Even if the price consolidates below the EMA (200) in the next few trading sessions, there is the potential for the dreaded death cross to occur, where the EMA (50) crosses below the EMA (200).

This would attract a lot of headlines in the financial media, and would almost become self-fulfulling because these negative headlines by themselves often encourage people to sell their shares and force the markets lower.

So while there is always the possibility of a consolidation or even a reversal, the markets are looking very weak right now, and if the price breaks below the recent lows, there could be a much bigger sell-off.

Filed Under: Analysis Tagged With: dow jones, s&p500

US Markets Crash – 200-Day Moving Averages Breached Already

October 11, 2018 by James Woolley Leave a Comment

Is the Bull Run Over?

There is no doubt that the US stock markets have had a fantastic run since they hit their lows back in 2008 and 2009 after the financial banking crisis.

The Dow Jones has gone from 6500 to around 27000 earlier this year, and the S&P 500 has posted similar gains, rising from around 670 to around 2940.

Indeed this has helped global stock markets soar higher in recent years, which has resulted in many active and passive investors growing their portfolios quite substantially.

However yesterday’s big sell off, triggered in part by the threat of rapidly rising interest rates, could signal that the bull run is finally over.

Yesterday’s Sell-Off

The fact is that many US companies had become seriously overvalued due to continued share price rises, and this was even more true for many of the top technology companies.

So my own personal view is that yesterday’s sell-off, which saw 800+ points wiped off the Dow Jones, has been a long time coming, and is actually quite healthy in many respects, even if it has negatively affected my own portfolio of UK stocks.

Now we just need to wait and see if this is a short-term correction or the start of a long-term correction, but using the 200-day moving averages as a guide, the future is looking ominous.

200-Day Moving Averages

The big price rises had seen the price of the major US stock indices continue to trade far higher than the 200-day moving average of these indices, but yesterday’s falls have already seen the price come back to trade close to this key support level in both instances.

Here is the daily chart of the Dow Jones…

Dow Jones Chart After October Sell-Off

….and here is the daily chart of the S&P 500…

S&P 500 Chart After October Sell-Off

As you can see, with the futures once again trading lower today, the price has actually dipped below the 200-day exponential moving average on the S&P 500 at the time of writing.

Future Price Direction

A fall below the 200-day moving average isn’t enough to signal the start of a new bear market, so it is still far too early to call.

However if the price continues to trade below this critical level for the next few weeks, the shorter-term EMA (50) will eventually cross below the EMA (200), triggering a death cross, and this would be a much stronger signal that we are seeing the start of a new bear market.

Therefore there is the potential for the Dow Jones to test the previous low of 2018 – 23112 – and for the S&P 500 to test the previous low of 2553 at the very least.

Whatever happens, these are interesting times whether you are a trader or investor, and it is going to be very interesting to see where the price of these major US indices go from here.

Filed Under: News Tagged With: dow jones, s&p500

  • « Previous Page
  • 1
  • 2

Forex Rebates:

Choose from 40+ different forex brokers and crypto exchanges, and get cashback every time you trade:


Copy Profitable Traders:

If you join ZuluTrade, you can follow and subscribe to profitable traders and all of their trades will be automatically copied in your own trading account.

You can also earn money as a signal provider if you are already a profitable trader.

Click here to find out more

Recommended Broker:

Recent Blog Posts:

  • High Probability Trade on S&P 500 – 26 January 2024
  • Oanda Moves Into Prop Trading With Labs Trader Program
  • My eToro Performance in 2023 – Up 33.24%
  • The5ers Offering $20K Bootcamp Challenge For Just $1
  • Example of VWAP Bounce Trade on S&P 500 – 18 December 2023

Recent Articles:

VWAP Indicator
  • MA Sabres (LuxAlgo) Indicator
  • 10 Harsh Truths About Forex Trading
  • Best Websites for Monitoring Currency Strengths
  • Xmaster Formula Indicator for MT4 and MT5
  • Tools:

    Currency Heat Map

    Categories

    • Analysis
    • News

    Archives

    • January 2024
    • December 2023
    • November 2023
    • October 2023
    • September 2023
    • August 2023
    • July 2023
    • June 2023
    • May 2023
    • August 2020
    • June 2020
    • May 2020
    • April 2020
    • January 2020
    • December 2019
    • November 2019
    • October 2019
    • September 2019
    • August 2019
    • July 2019
    • June 2019
    • May 2019
    • April 2019
    • March 2019
    • February 2019
    • January 2019
    • December 2018
    • November 2018
    • October 2018
    • September 2018
    • August 2018
    • July 2018
    • June 2018
    • May 2018
    • March 2016
    • December 2015
    • November 2015
    • October 2015
    • August 2015
    • July 2015

    Disclaimer

    This website should be used for general information purposes only and in no way represents professional financial advice.

    Forex and CFD trading carries a high level of risk and it is possible to lose more than your initial deposit if using leveraged products.

    Copyright © 2025 · eleven40 Pro Theme on Genesis Framework · WordPress · Log in

    • About
    • Contact
    • Disclosure
    • Privacy Policy
    • Terms Of Service