The Forex Chronicles

  • Rebates
  • Brokers
  • News
  • Analysis
  • Signals
    • Best Copy / Social Trading Platforms
    • eToro Review
    • FXTM Invest Review
    • Marketclub Review
    • ZuluTrade Review
  • Indicators
  • Strategies
  • Articles

EUR/USD Price Action in 2019 Highlights Importance of EMA (200)

November 18, 2019 by James Woolley Leave a Comment

Moving Average Trend Benefits

If you ask a technical trader which indicators they like to use when trading the forex markets, you can be certain that many of them will use moving averages.

That’s because these simple indicators give you an instant snapshot of the current trend in the markets.

It doesn’t matter if you are using the simple, exponential, volume or weighted moving average. If the indicator is moving higher, then the market is in an upward trend, and if it is moving lower, it is obviously in a downward trend.

The 200-Day Moving Average

You can use many different period settings for whichever moving average you like to use to immediately identify the short, medium and long-term trend at any given time, but one of the most useful and most widely used indicators that many longer term traders like to use is the 200-day moving average.

It is largely down to personal preference whether you use the simple or exponential moving average, but they both highlight the long-term trend really well.

I personally use the 200-day exponential moving average, or EMA (200) for short, and have always found it to be really useful when trading currencies and stocks.

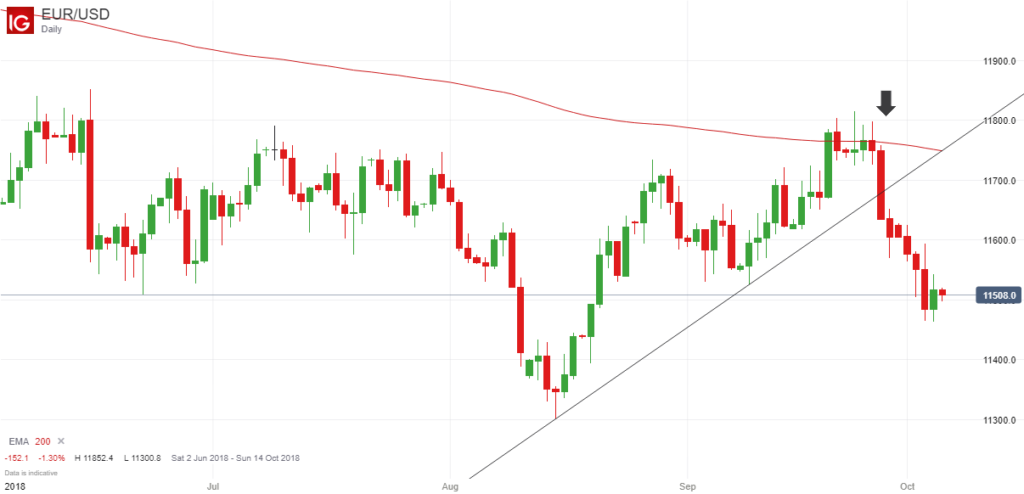
It’s often significant when the price breaks through this EMA (200), and is equally significant when many of the shorter-term moving averages cross above or below this indicator because it will often indicate a change of trend.

However it can often act as a strong support or resistance level, particularly after the price has risen or fallen sharply in a short space of time, and in this article I thought I would demonstrate this by showing you the daily price chart of the EUR/USD pair:

EURUSD Daily Price Chart 2019

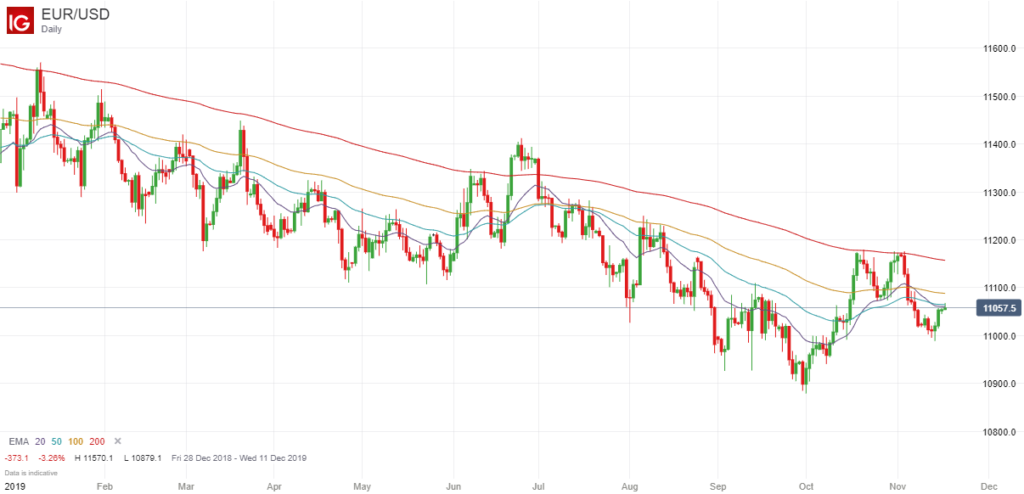
Strong Resistance in 2019

As you can see from the chart above, the price of the EUR/USD has been slowly trending downwards for much of 2019, but there have always been some mini-rallies along the way.

More importantly, you will see that on most occasions the price has not only struggled to break through this key indicator (shown in red), but has run into strong resistance and been actively driven lower every time it came close to this indicator, except for one occasion when it briefly traded slightly above particular indicator.

Conclusion

Therefore the point that I want to get across in this article is that traders pay close attention to the 200-day exponential moving average, and as a result of this, any resulting price moves almost become self-fulfilling once the price starts to move away from this key level.

On many occasions it will act as strong support or resistance, as was the case here with the EUR/USD, where you could have made some good returns going short each time the price got close to the EMA (200), but it can also signal a change of trend when it is finally broken, in which case you can also potentially make some good returns because you can get in at the start of a new trend.

So it is always worth adding the EMA (200) to your daily price chart if you like to trade this time frame.

Filed Under: Analysis Tagged With: eurusd

The EUR/USD is Bearish on all Time Frames in February 2019

February 6, 2019 by James Woolley Leave a Comment

Identifying Trends

One way of identifying whether a particular forex pair is trending upwards or downwards is to simply plot a series of short, medium and long-term moving averages on your price chart.

I like to use the 20, 50, 100 and 200-period exponential moving averages (EMAs), but you can use simple or weighted moving averages, or use different periods if you prefer.

The point is that if the price is currently trading above all of these moving averages, then it is currently in a positive upward trend, and if it is currently trading below all of these moving averages, it is now in a downward trend.

The EUR/USD Trend

If you really want to see the bigger picture, you can plot these moving averages on multiple time frames, and if you do this for the EUR/USD pair, you will see that it is generally trading below these moving averages on every time frame.

This is true for the monthly, weekly, daily, 4-hour, 1-hour and 15-minute time frame, so it is clear that this pair is in a very strong downward trend right now.

EURUSD Charts - February 2019

How to Trade the EUR/USD Pair

The question is; how can you use this information to successfully trade the EUR/USD pair going forward?

Well a lot of currency traders will be looking to trade a possible reversal because there is sure to be some kind of bounce at some stage. After all, it can’t keep on falling forever. Therefore they may be looking for some kind of divergence or a significant pin bar, for example, for a chance to go long.

However this is a very risky strategy because as I said above, this pair is in a downward trend on multiple time frames, so you are always trading against the prevailing trend.

A much better strategy would be to wait for a significant pull-back and then wait for an opportunity to go short as soon as it looks like it is going to turn downwards again. That’s because it is much easier to trade with the overall trend rather than against it.

As always, I am not offering any professional trading or financial advice. I just wanted to highlight how strong the US dollar is right now, and how weak the Euro is right now because the EUR/USD pair is looking seriously bearish on pretty much every single time frame.

Filed Under: Analysis Tagged With: eurusd

EUR/USD Analysis – The Power of Pin Bars and Inside Bars

October 5, 2018 by James Woolley Leave a Comment

Introduction

The EUR/USD pair traded in a sideways trading range for much of the summer, but suddenly burst into life in August when the price broke out to the downside.

It eventually found support at 1.1300 and came back into the previous trading range, before heading higher to touch the 200-day exponential moving average, which would have been an obvious exit point for many traders who had opened long positions prior to this.

This key moving average then acted as resistance and the price broke below the trendline that indicated the upward trend in August and September, and has continued drifting lower ever since.

EURUSD Price Chart - October 2018

Importance of Pin Bars, Inside Bars, Trendlines and EMA (200)

The real point that I wanted to get across in this article is that if you combine some of the most trusted candlestick patterns with trendlines and key areas of support and resistance, you can get some very powerful trading signals.

That’s exactly what we had with this pair because if you look at the daily price chart of the EUR/USD pair above, you can see all of these things combined to form a powerful reversal signal, and a clear signal to go short.

First of all, the price hit the EMA (200), and if you look at the subsequent price action, you can see that the price struggled to close above this key level.

Secondly, you can see that there was a clear pin bar where the price opened below the EMA (200) and surged higher above 1.1800 during the day’s session, but lacked momentum and dropped back to around its opening price, which was another key signal.

Thirdly, in the few days after this pin bar had formed, the two daily candles traded within the range of the pin bar and both had small bodies, which again indicated a reluctance to take the price higher.

Finally, the price broke below the range of the pin bar (which would have been the perfect time to open a short position), and if you were late to the party, you would have seen that this pair closed below the trendline, which would have given you another good opportunity to open a short position.

The price is now back at around the 1.1500 level. So even if you had entered late, you could have banked up to 170 points so far, which is obviously an excellent return.

Closing Comments

The point is that pin bars, inside bars, key resistance levels and breaks of trendlines are all powerful reversal signals all by themselves, but when they all combine to give the same signal, you end up with a really high probability set-up that is much more likely to be successful.

So it is always worth scanning through the various forex pairs to look for these ultra-strong signals because although they don’t necessarily occur that often, they can be very profitable when they do.

Filed Under: Analysis Tagged With: eurusd, inside bar, pin bar, trendline

EUR/USD Approaching Strong Resistance Level At 1.1700

August 27, 2018 by James Woolley Leave a Comment

Previous Price Breakout

I have posted a few trading updates about the EUR/USD pair just recently, and as you may recall, I pointed out that it was worth watching out for a possible breakout when the price was trading in a very narrow channel.

Well the price did in fact drop below this channel and although it did pull back a little, it did subsequently drop around 280 points from the closing price of the initial breakout candle.

Since then the price of the EUR/USD pair has rallied somewhat and is now back to where it was before this downwards breakout. So where does the price go from here?

Resistance at 1.1700

Well if we keep the same trendlines on the chart from last time, it is clear that there is strong resistance at these levels.

EURUSD Price Resistance At 1.1700

First of all, the upward and downward trendline from the previous channel act as resistance, but you will also notice that the EMA (100) is sitting just above this trendline at around 1.1700.

So when you also consider that these round numbers often act as strong support and resistance levels, it is clear that it is going to be hard for the price to break through this level in the coming days.

Trading Opportunities

At the time of writing, the price of the EUR/USD has reached a high of just over 1.1650 at the start of the overnight trading session (check out the last blog post to read about a trader who has managed to develop a highly profitable overnight trading strategy for the EUR/USD pair), but has subsequently dropped back to 1.1600. So it has already been sold off after approaching this resistance level.

Therefore if the price moves above 1.1650 towards the critical 1.1700 level once again, a short position might be a high probability trading opportunity that is worth taking because the price is unlikely to have the momentum to break through this level.

Alternatively, it might be worth watching just to see how the price reacts and then opening a position accordingly.

For example, if the price is sold off once again, you might want to think about opening a short position between 1.1600 and 1.1650, but if the price does actually break strongly upwards through the 1.1700 level, it might be worth opening a long position and trading a possible upward breakout because this is quite a strong level of resistance.

Disclaimer: These are just my own personal thoughts and doesn’t in any way represent financial advice. You should always do your own research and make your own decisions when trading forex.

Filed Under: Analysis Tagged With: eurusd, resistance

Night Trading Strategy On The EUR/USD Pair

August 23, 2018 by James Woolley 2 Comments

Profitable ZuluTrade Traders / Strategies

It has often been the case that many of the top signal providers on ZuluTrade (and other sites) tend to trade various different currency pairs, and will generally trade during the busiest times of the day, ie the London and New York sessions.

So it is quite surprising to discover that one of the most profitable signal providers is actually using a night trading strategy on the EUR/USD pair because this pair doesn’t usually move a great deal during the quiet overnight session.

Any strategy that is used during this session has to capture lots of small gains in the region of 5-10 pips because of the low volatility, but this particular strategy appears to do just that.

ThePipsMasterUK’s Strategy

Unfortunately it is hard to find out the exact strategy that this trader is using, but if you visit their trader profile page, you can read more about it.

You will see that this trader uses a number of different filters to find possible entry points, and will often open several positions in order to catch the trend.

Indeed they will actually open up to a maximum of 8 positions (0.1 lots per trade) at any one time, so this is something to bear in mind if you decide to copy the signals of this trader in your own account.

Most interesting of all is that this trader specifically trades the overnight session to avoid the volatility of the daytime sessions, and only ever trades the EUR/USD pair, which is good because it means that they have learned the behaviour of this pair and know exactly how it is likely to move during this session.

This certainly seems to be a profitable strategy because most of their trades tend to be closed out for a profit of between 5 and 8 pips, on average, and the losses are generally very small on the rare occasions that they do experience a losing trade.

Trading Results

At the time of writing (23 August 2018), ThePipsMasterUK is currently ranked as the 9th best trader on ZuluTrade, and has a total profit of 2429 pips since they started trading in March 2018.

They have had 395 winning trades out of 402, which equates to a remarkable 98% success rate, with an average profit of 6 pips, a best trade of 34 pips and a worst trade of -58 pips.

It should be pointed out that this trader appears to use a maximum stop loss of around 150 pips, so I would imagine that big losses could occur from time to time, but nevertheless I think it will be interesting to keep an eye on the performance of this particular trader, and to see if their night trading strategy on the EUR/USD pair continues to yield results.

Here is a widget that displays the very latest trading results of ThePipsMasterUK:

If you would like to automatically trade the signals of this trader in your own trading account, or would like to open a free demo account with ZuluTrade, you can do so by clicking on the Follow or Register buttons above.

However please note that I am not recommending that you copy the signals of ThePipsMasterUK or any other signal provider. This blog post is designed to be used for educational purposes only, and does not represent financial advice. You are solely responsible for any trading decisions that you make.

Final Thoughts

The main point I want to get across is that you don’t necessarily need to come up with a strategy that looks to capitalize on large price swings or high volatility.

By trading the overnight sessions, you can trade at a more relaxed pace with reduced volatility and no market-moving news announcements to worry about, and the long-term success of this particular trader suggests that it is definitely possible to be successful by coming up with a night strategy that trades the EUR/USD pair, or any other major pair that has tight spreads.

Filed Under: News Tagged With: eurusd, night trading, strategy, thepipsmasteruk

  • 1
  • 2
  • Next Page »

Forex Rebates:

Choose from 40+ different forex brokers and crypto exchanges, and get cashback every time you trade:


Copy Profitable Traders:

If you join ZuluTrade, you can follow and subscribe to profitable traders and all of their trades will be automatically copied in your own trading account.

You can also earn money as a signal provider if you are already a profitable trader.

Click here to find out more

Recommended Broker:

Recent Blog Posts:

  • High Probability Trade on S&P 500 – 26 January 2024
  • Oanda Moves Into Prop Trading With Labs Trader Program
  • My eToro Performance in 2023 – Up 33.24%
  • The5ers Offering $20K Bootcamp Challenge For Just $1
  • Example of VWAP Bounce Trade on S&P 500 – 18 December 2023

Recent Articles:

VWAP Indicator
  • MA Sabres (LuxAlgo) Indicator
  • 10 Harsh Truths About Forex Trading
  • Best Websites for Monitoring Currency Strengths
  • Xmaster Formula Indicator for MT4 and MT5
  • Tools:

    Currency Heat Map

    Categories

    • Analysis
    • News

    Archives

    • January 2024
    • December 2023
    • November 2023
    • October 2023
    • September 2023
    • August 2023
    • July 2023
    • June 2023
    • May 2023
    • August 2020
    • June 2020
    • May 2020
    • April 2020
    • January 2020
    • December 2019
    • November 2019
    • October 2019
    • September 2019
    • August 2019
    • July 2019
    • June 2019
    • May 2019
    • April 2019
    • March 2019
    • February 2019
    • January 2019
    • December 2018
    • November 2018
    • October 2018
    • September 2018
    • August 2018
    • July 2018
    • June 2018
    • May 2018
    • March 2016
    • December 2015
    • November 2015
    • October 2015
    • August 2015
    • July 2015

    Disclaimer

    This website should be used for general information purposes only and in no way represents professional financial advice.

    Forex and CFD trading carries a high level of risk and it is possible to lose more than your initial deposit if using leveraged products.

    Copyright © 2025 · eleven40 Pro Theme on Genesis Framework · WordPress · Log in

    • About
    • Contact
    • Disclosure
    • Privacy Policy
    • Terms Of Service