The Forex Chronicles

  • Rebates
  • Brokers
  • News
  • Analysis
  • Signals
    • Best Copy / Social Trading Platforms
    • eToro Review
    • FXTM Invest Review
    • Marketclub Review
    • ZuluTrade Review
  • Indicators
  • Strategies
  • Articles

Gold Chart Highlights Significance of Historical Trendlines

April 2, 2019 by James Woolley Leave a Comment

Gold Price Action

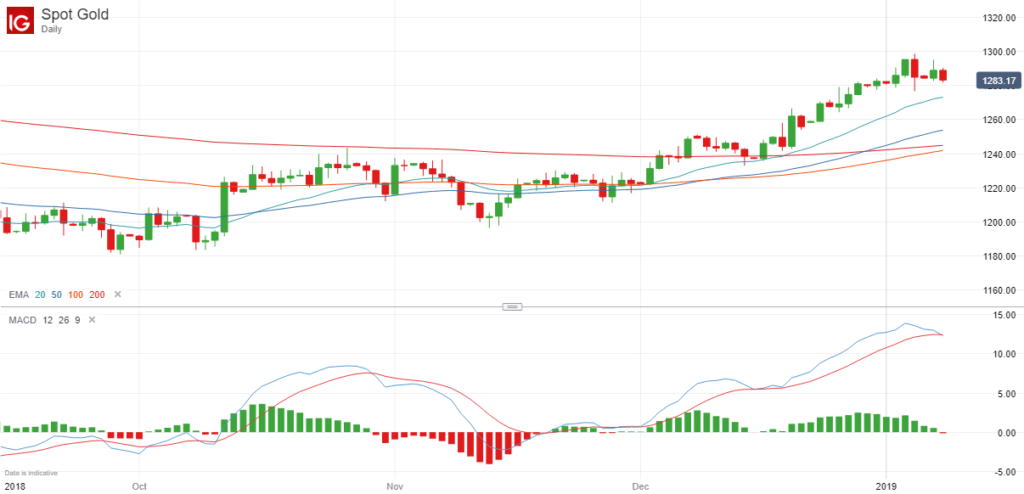
If you look at the long-term daily chart of gold, you will see that the price has been steadily rising upwards since the end of 2018.

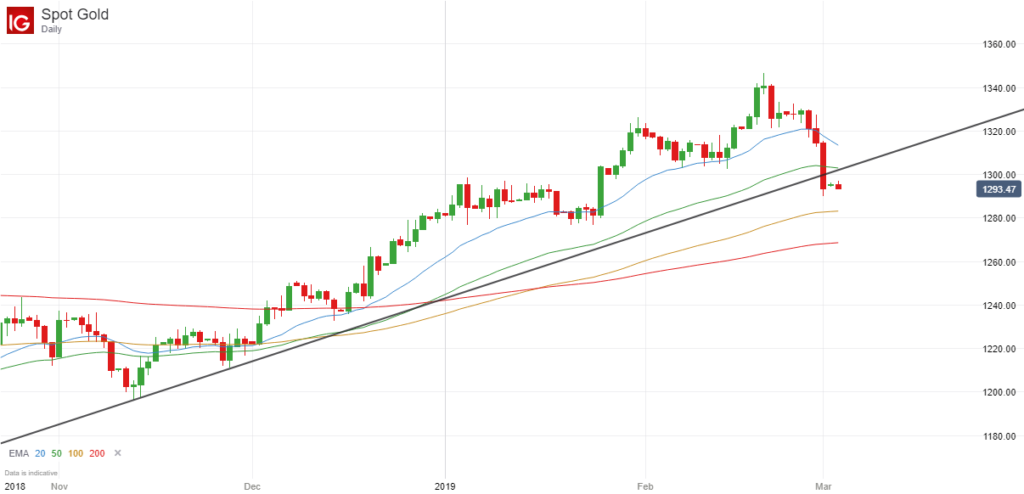
As you can see from the chart below, the trendline marking the two lowest points at the start of this move has been a good guide because the price stayed above this trendline for many weeks and months and never really threatened to go below this line.

Gold Price Chart - 2 April 2019

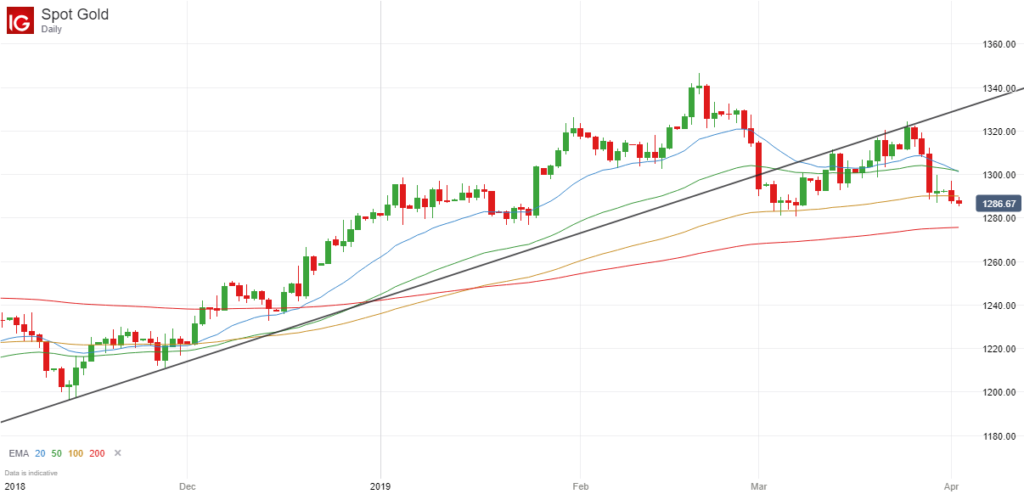
Indeed the price crossed above the 200-day exponential moving average, as did the 20, 50 and 100-day moving averages, highlighting a very strong upward move.

The price actually reached a high of around $1346, but it has since fallen below this trendline, but the interesting thing is that this trendline is now acting as resistance.

Trendline Resistance

This occurs quite often in the financial markets. A trendline that previously acted as support is now acting as resistance, and the reason why is because traders and financial institutions are always looking for strong areas of support or resistance to place their trades, and this is one such example.

In this case, after breaking below the initial trendline, the price has bounced back on several occasions, but has struggled to move above this extended trendline. In fact on every occasion gold has been sold off whenever it has come close to this line.

Subsequently the upward momentum finally subsided and the price is now back below the critical $1300 level at $1287.

Future Price Direction

It is quite hard to predict where the price is going to go from here, but you would have to say that it is more likely to continue falling further below $1300, particularly if the general stock markets remain strong.

The trendline is likely to continue acting as resistance if the price does bounce back, and at the current time, it is hard to see what kind of economic factors are going to drive the price above this level.

Furthermore, the 200-day moving average is starting to become significant once again because the price is only just above this key indicator.

If it were to fall below this moving average and was backed by strong volumes, then there could be a much more sustained downwards move, with price targets of $1260, $1240 and $1220 being easily achievable in the short-medium term.

Anyway the key point I wanted to make is that historical trendlines can be very significant when you are looking for areas of support and resistance, and this is a classic example of one such instance.

Filed Under: Analysis Tagged With: gold, gold price

Gold Breaks Below $1300 – March 2019

March 4, 2019 by James Woolley Leave a Comment

Introduction

With the major stock markets surging higher in 2019, I think many people naturally assumed that the price of gold would struggle to stay above $1300. I know I certainly did because I made this exact point in previous blog posts.

Well it has taken a while because the price of gold headed to around $1345 a few weeks ago, but it has since fallen back sharply and is now trading below $1300 at around $1293.5 at the time of writing.

Indeed this was apparently the biggest weekly decline since August 2018, which shows just how strong a move this actually was last week.

It is not an insignificant move either because if you look at the long-term daily chart below, you can see that it has broken below the upward trendline that has been in place since November last year:

Gold Daily Chart - 4 March 2019

The question is; where does it go from here?

Future Price Direction

It is actually very difficult to call this market right now because it largely depends on what the stock markets do in the coming weeks, and these too are difficult to call.

With Britain scheduled to leave the European Union at the end of this month, and Donald Trump’s comments and actions continuing to weigh heavily on the markets, nobody can really be sure if the markets are going to continue to move higher in the future, or whether they will finally start to run out of momentum and fall back.

Brexit alone is causing so much uncertainty because it is looking increasingly unlikely that there will be a firm resolution before the official exit date, and the USA’s future relationship with China and other countries isn’t any clearer.

So all we can really do is to rely on technical analysis to guide us with regards to the gold price, and in that respect you would have to say that gold may well struggle to break back above the $1300 level now that it has broken below this significant round number.

Looking further ahead, further weakness is likely and I would say that there is every chance that the price will move towards the 200-day exponential moving average at some point, which currently stands at around $1268.

Trading Opportunity

Although I am predicting further weakness below $1300, I wouldn’t necessarily say that this is a strong trading opportunity right now because it doesn’t really represent a high-probability trade.

With gold and other commodities, I think it is better to wait for a period of consolidation where the markets are range-bound for several weeks, and then trade the resulting breakout, similar to what we saw at the January when the price rocketed above $1300 after several weeks of sideways movement.

So it is probably better to wait and see if the price stays around the 1290-1300 level for several days because if this occurs, then a downward breakout could be a very profitable trade.

Filed Under: News Tagged With: gold, gold price

Gold Looking Overbought Around $1300

January 8, 2019 by James Woolley Leave a Comment

Previous Price Action

It is a long time since I talked about gold, but in my last post back in October, I highlighted the upwards price breakout that had just occurred on this particular commodity, and this proved to be a decisive breakout.

I remember saying at the time that I wasn’t really convinced about this specific breakout, but I turned out to be wrong because the price did indeed continue to creep higher in the following months.

This is primarily because people turn to safe havens in times of crisis, and November and December saw some of the biggest stock market falls on record.

As a result, the price of gold currently stands at $1283 at the time of writing, having previously traded close to $1200 for long periods of time.

Future Price Move

The stock markets have actually bounced back in recent weeks, and as a result of this, people have been selling gold to buy stocks, pushing the price down slightly.

After trading close to the $1300 level, which is an important round number, and therefore a key resistance level that needs to be broken, it has since fallen back to $1283, as mentioned above.

However I still think there is a possible trading opportunity here.

Gold Price Chart - 8 January 2019

Trading Opportunity

It is still too early to predict where the stock markets are headed because a continuation of the downward trend could be just around the corner, but I still believe that the price of gold will struggle to break through the significant $1300 level.

Therefore it might be worth looking for a clear reversal signal on the daily chart of this particular market for additional confirmation.

If you look at the price chart above, you can see that we have just had a downward MACD crossover, which is often seen as quite a strong reversal signalby itself, but I personally would be looking to enter a short closer to $1300 if possible.

Ideally I would like to see a pin bar on the daily chart because if the price pushed up towards $1300 once again, but ran out of momentum a second time before breaking lower, this would be the perfect time to go short.

So at the moment we just have to wait and see if this particular scenario plays out, but as always, I want to point out that these are just my own thoughts and opinions. This doesn’t represent professional financial or trading advice in any way.

Filed Under: Analysis Tagged With: gold, gold price

Death Cross on Gold (Weekly Chart)

September 13, 2018 by James Woolley Leave a Comment

What is a Death Cross?

A death cross occurs when a short-term moving average crosses below a long-term moving average, and is significant because it often signals the start of a new long-term bearish trend.

Traders will often use different time periods and different moving averages to find these downward crossovers, such as the 50 and 100-period simple moving averages (SMAs), for example, but 50 and 200-period exponential moving averages (EMAs) seem to be the most popular.

As always, these crossovers are more significant on the longer time frames, such as the daily and weekly time frames, and for that reason I want to alert you to a new death cross that is occurring right now on the weekly gold chart based on the EMA (50) and EMA (200).

Previous Price Action

Gold traders may already be aware of the death cross that has occurred on the daily chart of this particular commodity during the summer. If not, here is the daily price chart that highlights this downward moving average crossover:

Gold Death Cross - Daily Chart

You can see that the death cross occurred during June and resulted in sustained price falls during the following months as traders continued to close long positions, sell gold and actively short this commodity, helping to drive the price down from around $1300 per ounce to just $1160 per ounce.

Since then the price has bounced back to the $1200 level and seems to have found support around this level, but ultra long-term traders may be interested to know that there is a new death cross forming on the weekly chart, which suggests that the price could still go a lot lower.

New Death Cross on Weekly Price Chart

If you look at the weekly price chart of gold, you can see that the 50-week exponential moving average is crossing below the 200-week exponential moving average.

Gold Death Cross - Weekly Chart

This in itself doesn’t necessarily guarantee that the price will drop a lot further in the short-term. It may well rebound in the next few weeks and come back to the EMA (200) because the price has already fallen heavily in recent months.

However the long term implications of this death cross could be significant because in the past these crossovers have resulted in some long and sustained price moves, both to the upside (in the case of a golden cross) and the downside.

Therefore it could be argued that the price of gold could potentially fall to $1000 or lower in the coming months if traders act upon this weekly death cross and continue to drive the price lower.

So it will be interesting to watch the price of gold over the course of the next few years to see if this is a significant death cross or whether the price continues to trade in a sideways range.

Trading Opportunities

I wouldn’t necessarily recommend that you actively trade these death crosses, particularly on the weekly time frame. Nevertheless they do present opportunities because you can take note of this long-term trend and look to open short positions on any pull-backs.

For example, when the death cross is in force on the weekly chart, you might want to wait for pull-backs on the daily price chart and look for opportunities to open short positions where appropriate (downward breakouts from peaks, heavily overbought conditions, strong resistance at round numbers etc).

(If you would like to trade gold, AAAFX and Ayondo are two brokers that generally offer low spreads on this commodity).

Filed Under: Analysis Tagged With: death cross, gold, gold price

Forex Rebates:

Choose from 40+ different forex brokers and crypto exchanges, and get cashback every time you trade:


Copy Profitable Traders:

If you join ZuluTrade, you can follow and subscribe to profitable traders and all of their trades will be automatically copied in your own trading account.

You can also earn money as a signal provider if you are already a profitable trader.

Click here to find out more

Recommended Broker:

Recent Blog Posts:

  • High Probability Trade on S&P 500 – 26 January 2024
  • Oanda Moves Into Prop Trading With Labs Trader Program
  • My eToro Performance in 2023 – Up 33.24%
  • The5ers Offering $20K Bootcamp Challenge For Just $1
  • Example of VWAP Bounce Trade on S&P 500 – 18 December 2023

Recent Articles:

VWAP Indicator
  • MA Sabres (LuxAlgo) Indicator
  • 10 Harsh Truths About Forex Trading
  • Best Websites for Monitoring Currency Strengths
  • Xmaster Formula Indicator for MT4 and MT5
  • Tools:

    Currency Heat Map

    Categories

    • Analysis
    • News

    Archives

    • January 2024
    • December 2023
    • November 2023
    • October 2023
    • September 2023
    • August 2023
    • July 2023
    • June 2023
    • May 2023
    • August 2020
    • June 2020
    • May 2020
    • April 2020
    • January 2020
    • December 2019
    • November 2019
    • October 2019
    • September 2019
    • August 2019
    • July 2019
    • June 2019
    • May 2019
    • April 2019
    • March 2019
    • February 2019
    • January 2019
    • December 2018
    • November 2018
    • October 2018
    • September 2018
    • August 2018
    • July 2018
    • June 2018
    • May 2018
    • March 2016
    • December 2015
    • November 2015
    • October 2015
    • August 2015
    • July 2015

    Disclaimer

    This website should be used for general information purposes only and in no way represents professional financial advice.

    Forex and CFD trading carries a high level of risk and it is possible to lose more than your initial deposit if using leveraged products.

    Copyright © 2025 · eleven40 Pro Theme on Genesis Framework · WordPress · Log in

    • About
    • Contact
    • Disclosure
    • Privacy Policy
    • Terms Of Service