The Forex Chronicles

  • Rebates
  • Brokers
  • News
  • Analysis
  • Signals
    • Best Copy / Social Trading Platforms
    • eToro Review
    • FXTM Invest Review
    • Marketclub Review
    • ZuluTrade Review
  • Indicators
  • Strategies
  • Articles

Why Today Could Be A Significant Day For The Dow Jones And S&P 500

November 6, 2018 by James Woolley Leave a Comment

Introduction

After last month’s heavy stock market falls, the markets have bounced back as people have seen this as a good opportunity to pick up some cheap stocks.

As a result, the price of both the Dow Jones and S&P 500 has moved back upwards towards the 200-day exponential moving average, and above it in the case of the Dow Jones.

However even though we have seen a small rally of sorts, the markets are delicately poised right now and could yet go a lot lower.

Looking at the daily price charts of both indexes, I think today could well be a decisive day for the markets, and could potentially determine the future direction in the coming weeks. Let me explain why.

Pin Bar and Inside Bars

Dow Jones Daily Chart - 6 November 2018

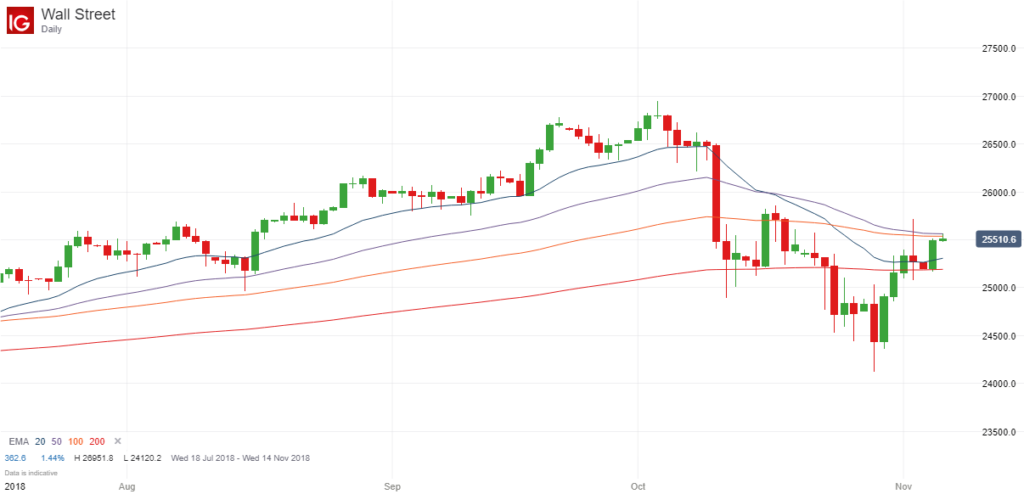
Last Friday we had a significant pin bar on both of these markets whereby the price moved a lot higher during the trading session but ultimately fell back downwards and closed close to where it opened.

This is important because it indicates that there wasn’t the momentum to drive it higher (and stay higher), and indicates that there is still a lot of uncertainty in the markets.

To confirm this point, there was an inside bar yesterday where the price traded within the range of this pin bar on both the Dow Jones and the S&P 500, which once again highlights a degree of uncertainty.

Finally, it is worth noting that the 20, 50, 100 and 200-period exponential moving averages have all converged in recent days and are now trading very close to each other, which often occurs before a significant breakout.

Future Price Direction

At this point in time it is absolutely impossible to predict which way the markets are going to go. However I think this is going to be an important trading session today because if the price of the Dow Jones or the S&P 500 closes above or below the range of last Friday’s pin bar, it could be the start of a massive breakout.

If this occurs, we could see the markets move hundreds of points upwards or downwards in either direction.

It could be the start of a new bullish recovery, which could continue right through until after Christmas because this is nearly always a good period for the stock markets, or alternatively it could be a continuation of last month’s falls and there may not even be any kind of Christmas rally this year.

For purely selfish reasons, I would prefer an upward breakout because this would have a positive knock-on effect on my UK stock portfolio, but I still have some cash on the sidelines ready and waiting to pick up some bargains if the markets move a lot lower.

Either way, it should be interesting to watch the price action today, and see if the price can close significantly outside of the range of this pin bar on both markets.

Filed Under: News Tagged With: dow jones, inside bar, pin bar, s&p500

EUR/USD Analysis – The Power of Pin Bars and Inside Bars

October 5, 2018 by James Woolley Leave a Comment

Introduction

The EUR/USD pair traded in a sideways trading range for much of the summer, but suddenly burst into life in August when the price broke out to the downside.

It eventually found support at 1.1300 and came back into the previous trading range, before heading higher to touch the 200-day exponential moving average, which would have been an obvious exit point for many traders who had opened long positions prior to this.

This key moving average then acted as resistance and the price broke below the trendline that indicated the upward trend in August and September, and has continued drifting lower ever since.

EURUSD Price Chart - October 2018

Importance of Pin Bars, Inside Bars, Trendlines and EMA (200)

The real point that I wanted to get across in this article is that if you combine some of the most trusted candlestick patterns with trendlines and key areas of support and resistance, you can get some very powerful trading signals.

That’s exactly what we had with this pair because if you look at the daily price chart of the EUR/USD pair above, you can see all of these things combined to form a powerful reversal signal, and a clear signal to go short.

First of all, the price hit the EMA (200), and if you look at the subsequent price action, you can see that the price struggled to close above this key level.

Secondly, you can see that there was a clear pin bar where the price opened below the EMA (200) and surged higher above 1.1800 during the day’s session, but lacked momentum and dropped back to around its opening price, which was another key signal.

Thirdly, in the few days after this pin bar had formed, the two daily candles traded within the range of the pin bar and both had small bodies, which again indicated a reluctance to take the price higher.

Finally, the price broke below the range of the pin bar (which would have been the perfect time to open a short position), and if you were late to the party, you would have seen that this pair closed below the trendline, which would have given you another good opportunity to open a short position.

The price is now back at around the 1.1500 level. So even if you had entered late, you could have banked up to 170 points so far, which is obviously an excellent return.

Closing Comments

The point is that pin bars, inside bars, key resistance levels and breaks of trendlines are all powerful reversal signals all by themselves, but when they all combine to give the same signal, you end up with a really high probability set-up that is much more likely to be successful.

So it is always worth scanning through the various forex pairs to look for these ultra-strong signals because although they don’t necessarily occur that often, they can be very profitable when they do.

Filed Under: Analysis Tagged With: eurusd, inside bar, pin bar, trendline

Gold Continues To Trade In Narrow Range Around $1200

September 25, 2018 by James Woolley Leave a Comment

Death Cross

If you are a regular reader of this site, you will know that I recently posted about the death cross that has just occurred on the weekly chart of gold.

This is basically where the 50-period moving average crosses below the 200-period moving average, and is generally considered to be a very bearish signal.

Since then the death cross has been confirmed, but it hasn’t resulted in a wave of sellers using this as an opportunity to drive the price lower.

This is not unexpected because these weekly signals can take a long time to unwind, but if you drop down to the daily chart, you will see that the price is really struggling for direction right now.

Narrow Trading Range

In recent weeks the price seems to have been glued to the critical $1200 level, and has struggled to break decisively above or below this significant round number with any real momentum or conviction, as you can see below:

Gold Narrow Trading Range - September 2018

So far this month it has recorded a low of $1187.8 and a high of $1214.4, but has remained in a very narrow trading range for several weeks now.

Inside Bar

In addition to trading in a very narrow range, we have also had a series of three consecutive inside bars in the last three trading sessions (if you include the Sunday session), which is always worth noting because these inside bar patterns will often present you with a profitable breakout opportunity when the price closes above or below the initial set-up bar.

Trading Opportunity

From a trading perspective, it is very hard to trade any instrument that is basically trading sideways with no clear direction, but it is still good to see such a pattern because it usually leads to a profitable set-up when the price eventually breaks out of this range.

This is particularly true when you have a series of inside bars within this sideways trading range, as is the case here.

Therefore it might be worth watching the price of gold in the coming weeks because there could be a strong price move when the price closes above or below both the set-up bar and the previous high or low of this trading range.

A downward break would arguably be preferable because we have already seen a death cross on the weekly chart, and there could subsequently be a lot of downside potential.

Nevertheless, an upward price breakout could still be worth trading because there is always the potential for the price to move back towards the 200-day exponential moving average or the 100-day exponential moving average, which currently stand at $1253.9 and $1228.3 respectively, before heading south once again.

The point is that these sideways trading ranges and inside bar formations can be very profitable to trade because in many cases the longer it remains in the range, and the longer the price trades within the initial set-up bar, the bigger the breakout once the price closes outside of this range.

To demonstrate this point, you only have to check out these two inside bar range breakouts that occurred on Bitcoin and the GBP/JPY pair last month.

Filed Under: Analysis Tagged With: breakout, gold, inside bar

Another Bitcoin Inside Bar Breakout For September 2018?

September 11, 2018 by James Woolley Leave a Comment

Previous Price Action

If you visit this site regularly, you will know from a previous post that there was a decent inside bar breakout that occurred on Bitcoin last month.

After trading in a sideways trading range for a considerable amount of time, there was an inside bar trading pattern whereby the price continued to trade within the range of the initial bar for several days, which reinforced my belief that it was only a matter of time before we saw a decent breakout, and that’s exactly what happened.

Bitcoin Inside Bar Breakout - August 2018

As I said previously, it wasn’t a perfect set-up because of the bearish breakout bar, but nevertheless you still could have generated up to 700 points profit by entering a long position at the closing price of the breakout candle.

Inside Bar Breakout Part II

If you take a look at the right hand side of the chart below to view the very latest price action, you will notice that history appears to be repeating itself.

Bitcoin Inside Bar - September 2018

After surging upwards to a high of around $7400, the price of Bitcoin has since fallen sharply and is now trading within the range of the previous inside bar.

Furthermore, we now have a new inside bar set-up because at the time of writing, the price has been trading within the range of the initial bar for the last three days.

The set-up bars are indicated by the arrows in the chart above, and you can see that the following bars / candles are all inside bars, which is often a great set-up for a significant breakout.

Trading Opportunity

As a result of this, it may be worth watching the price of this popular cryptocurrency to see if there is a good opportunity to enter a new long or short position (depending on the direction of the breakout) in the coming days.

It may be profitable to simply enter a trade when the price breaks out of the range of the initial set-up bar (and closes outside of this range), but I personally would like to see the breakout bar close outside of the range of the previous inside bar trading range as well because I think this range still carries a lot of weight and is highly significant.

Anyway I just thought I would share with you this latest inside bar set-up because the subsequent breakouts that occur can be very profitable. As always, this is not a recommendation to trade, it is just my own personal thoughts and opinions. Please be aware that cryptocurrency trading is very risky, and there is the potential to lose a lot of money.

Filed Under: Analysis Tagged With: bitcoin, breakout, inside bar

Inside Bar Breakouts On GBP/JPY And Bitcoin From Last Month

September 5, 2018 by James Woolley Leave a Comment

Introduction

As I have mentioned previously on this site, inside bar breakouts are some of the my favorite trading patterns to trade because they will often yield some excellent profits.

This is particularly true when these inside bar breakouts come towards the end of a trend because they often provide solid confirmation that a reversal is taking place.

So with that in mind, I thought I would share you two profitable inside bar breakouts that occurred last month, ie August 2018, to give you an idea of how you can potentially trade these breakouts in the future.

Bitcoin Inside Bar Breakout

The first breakout is one that I have already discussed already in a previous blog post. On this occasion I actually discussed an inside bar breakout opportunity before it occurred, when I highlighted Bitcoin’s narrow trading range.

As you can see from the chart below, the price was trading sideways for long periods of time with no clear direction, with all the inside bar candles trading within the range of the initial bar.

Bitcoin Price Chart - August 2018

This is always a good set-up for a potential breakout, and this is what subsequently happened:

Bitcoin Inside Bar Breakout - August 2018

From a trading perspective, this wasn’t a perfect set-up because the breakout candle wasn’t exactly a decisive one. It is always a better signal when the price breaks strongly upwards or downwards out of its narrow trading range, but nevertheless this is one that would still have yielded decent profits of nearly 700 points so far if you had entered at the closing price of the first breakout candle.

GBP/JPY Inside Bar Breakout

Another decent set-up from last month occurred on the daily chart of the GBP/JPY pair. This pair had fallen sharply, along with many of the other GBP pairs, and during a period of consolidation, several inside bars had started to form.

Therefore when the price closed above the initial candle, this was a good opportunity to open a new long position and trade the breakout and the reversal.

GBPJPY Inside Bar Breakout - August 2018

As you can see from the chart above, this had a much stronger breakout candle and would also have yielded some decent returns. With the momentum gathered from the positive Brexit news that was starting to emerge, the price moved around 250 points higher from the closing price of the breakout candle, and although it has since dropped back a little, it could still go higher.

Final Thoughts

It is worth mentioning that these inside bar breakouts don’t occur that often across all of the major currency pairs, but when they do occur, they can be very profitable when you get the right set-up.

I would also add that I would feel more confident trading a major currency pair, such as the GBP/JPY pair, for example, rather than a cryptocurrency such as Bitcoin simply because they are completely unregulated and have large spreads, and no-one really knows what could happen in the future. They could easily rise or fall thousands of dollars in a single day, and subsequently destroy your capital if you are not careful.

Filed Under: Analysis Tagged With: bitcoin, breakout, gbpjpy, inside bar

  • « Previous Page
  • 1
  • 2
  • 3
  • 4
  • Next Page »

Forex Rebates:

Choose from 40+ different forex brokers and crypto exchanges, and get cashback every time you trade:


Copy Profitable Traders:

If you join ZuluTrade, you can follow and subscribe to profitable traders and all of their trades will be automatically copied in your own trading account.

You can also earn money as a signal provider if you are already a profitable trader.

Click here to find out more

Recommended Broker:

Recent Blog Posts:

  • High Probability Trade on S&P 500 – 26 January 2024
  • Oanda Moves Into Prop Trading With Labs Trader Program
  • My eToro Performance in 2023 – Up 33.24%
  • The5ers Offering $20K Bootcamp Challenge For Just $1
  • Example of VWAP Bounce Trade on S&P 500 – 18 December 2023

Recent Articles:

VWAP Indicator
  • MA Sabres (LuxAlgo) Indicator
  • 10 Harsh Truths About Forex Trading
  • Best Websites for Monitoring Currency Strengths
  • Xmaster Formula Indicator for MT4 and MT5
  • Tools:

    Currency Heat Map

    Categories

    • Analysis
    • News

    Archives

    • January 2024
    • December 2023
    • November 2023
    • October 2023
    • September 2023
    • August 2023
    • July 2023
    • June 2023
    • May 2023
    • August 2020
    • June 2020
    • May 2020
    • April 2020
    • January 2020
    • December 2019
    • November 2019
    • October 2019
    • September 2019
    • August 2019
    • July 2019
    • June 2019
    • May 2019
    • April 2019
    • March 2019
    • February 2019
    • January 2019
    • December 2018
    • November 2018
    • October 2018
    • September 2018
    • August 2018
    • July 2018
    • June 2018
    • May 2018
    • March 2016
    • December 2015
    • November 2015
    • October 2015
    • August 2015
    • July 2015

    Disclaimer

    This website should be used for general information purposes only and in no way represents professional financial advice.

    Forex and CFD trading carries a high level of risk and it is possible to lose more than your initial deposit if using leveraged products.

    Copyright © 2025 · eleven40 Pro Theme on Genesis Framework · WordPress · Log in

    • About
    • Contact
    • Disclosure
    • Privacy Policy
    • Terms Of Service