The Forex Chronicles

  • Rebates
  • Brokers
  • News
  • Analysis
  • Signals
    • Best Copy / Social Trading Platforms
    • eToro Review
    • FXTM Invest Review
    • Marketclub Review
    • ZuluTrade Review
  • Indicators
  • Strategies
  • Articles

Double Pin Bar on USD/CAD at Start of September

September 9, 2019 by James Woolley Leave a Comment

Introduction to Pin Bars

I was listening to a podcast over the weekend and one of the traders being interviewed said that despite having about three core strategies that she likes to use, it is the simple pin bar that often provides her with the best signals.

To remind you, a pin bar is essentially where you have a long candlestick with a very small body, and when you get these pin bars towards the end of an upward or downward trend, it often signals that the trend is running out of momentum and likely to reverse.

One pin bar by itself often provides a very good trend reversal signal, but when you get two pin bars together, it is often a very strong signal that the trend is coming to an end.

Real-Life Example From USD/CAD Pair

I was reminded of this just recently when I was looking at the daily chart of the USD/CAD pair. As you can see below, the price has been recovering strongly since the middle of July, and has recently crossed above the 200-day moving average:

USDCAD Double Pin Bar - September 2019

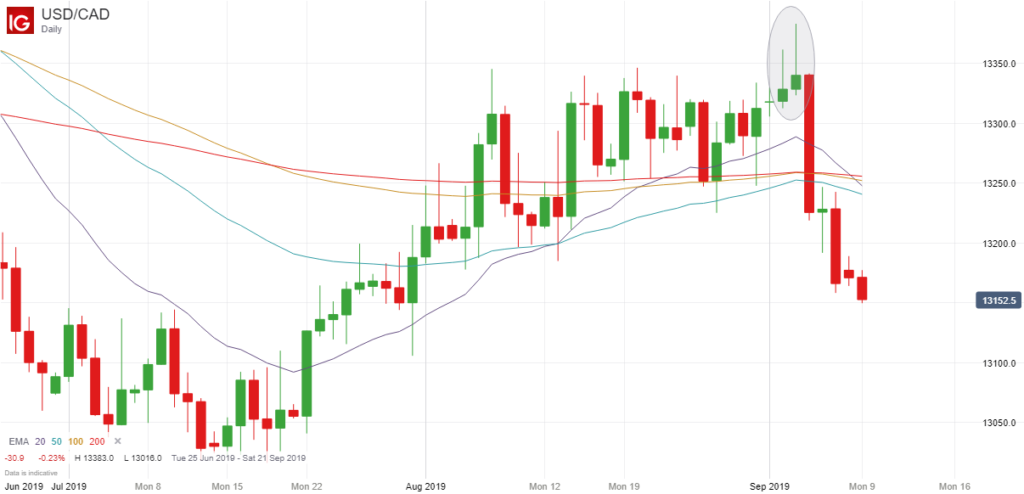
More significantly, it also threatened to break even higher last week after being stuck in quite a narrow trading range for a number of weeks, but after posting two new highs on consecutive days, the price fell back down on both occasions and ended up forming a pin bar on both days.

Trading Opportunity

As a result of this double pin bar formation, there was a good opportunity to place an order to open a short position a few pips below the lowest point of these two pin bars at around 1.3310 to catch any reversal, and as it turned out, this would have been a very profitable trade.

At the time of writing, the USD/CAD is trading at around 1.3150, which equates to around 160 points profit if you had entered a short position just below the lowest point of the two pin bars.

Final Thoughts

The point of this article was not simply to highlight a profitable set-up that you might have missed. It was to demonstrate how profitable these double pin bar set-ups can be when they actually occur.

Unfortunately they don’t tend to occur very often, so you won’t necessarily be able to trade these high-probability set-ups several times a month, for example, but it is worth keeping an eye out for them, particularly on the longer time frames when the odds of success are so much higher.

What I like about pin bars, and double pin bars in particular, is that there is an obvious place to place your stop loss – a few pips above the highest point of the two pin bars, as in this case, or a few pips below the lowest point in a downward trend.

The difficult part is trying to work out where you should take profits because sometimes you can get a large reversal, as was the case here with the USD/CAD pair, whereas other times the price may only move 10-20 pips before consolidating in the previous trading range or continuing its previous trend.

Therefore it could be argued that the best pin bar strategy is to close half the position for a small profit and let the other half run for as long as possible, but everyone will have their own methods of trading these high-probability set-ups. Ultimately you just have to find a strategy that works for you.

Filed Under: Analysis Tagged With: pin bar, usdcad

Why Today Could Be A Significant Day For The Dow Jones And S&P 500

November 6, 2018 by James Woolley Leave a Comment

Introduction

After last month’s heavy stock market falls, the markets have bounced back as people have seen this as a good opportunity to pick up some cheap stocks.

As a result, the price of both the Dow Jones and S&P 500 has moved back upwards towards the 200-day exponential moving average, and above it in the case of the Dow Jones.

However even though we have seen a small rally of sorts, the markets are delicately poised right now and could yet go a lot lower.

Looking at the daily price charts of both indexes, I think today could well be a decisive day for the markets, and could potentially determine the future direction in the coming weeks. Let me explain why.

Pin Bar and Inside Bars

Dow Jones Daily Chart - 6 November 2018

Last Friday we had a significant pin bar on both of these markets whereby the price moved a lot higher during the trading session but ultimately fell back downwards and closed close to where it opened.

This is important because it indicates that there wasn’t the momentum to drive it higher (and stay higher), and indicates that there is still a lot of uncertainty in the markets.

To confirm this point, there was an inside bar yesterday where the price traded within the range of this pin bar on both the Dow Jones and the S&P 500, which once again highlights a degree of uncertainty.

Finally, it is worth noting that the 20, 50, 100 and 200-period exponential moving averages have all converged in recent days and are now trading very close to each other, which often occurs before a significant breakout.

Future Price Direction

At this point in time it is absolutely impossible to predict which way the markets are going to go. However I think this is going to be an important trading session today because if the price of the Dow Jones or the S&P 500 closes above or below the range of last Friday’s pin bar, it could be the start of a massive breakout.

If this occurs, we could see the markets move hundreds of points upwards or downwards in either direction.

It could be the start of a new bullish recovery, which could continue right through until after Christmas because this is nearly always a good period for the stock markets, or alternatively it could be a continuation of last month’s falls and there may not even be any kind of Christmas rally this year.

For purely selfish reasons, I would prefer an upward breakout because this would have a positive knock-on effect on my UK stock portfolio, but I still have some cash on the sidelines ready and waiting to pick up some bargains if the markets move a lot lower.

Either way, it should be interesting to watch the price action today, and see if the price can close significantly outside of the range of this pin bar on both markets.

Filed Under: News Tagged With: dow jones, inside bar, pin bar, s&p500

EUR/USD Analysis – The Power of Pin Bars and Inside Bars

October 5, 2018 by James Woolley Leave a Comment

Introduction

The EUR/USD pair traded in a sideways trading range for much of the summer, but suddenly burst into life in August when the price broke out to the downside.

It eventually found support at 1.1300 and came back into the previous trading range, before heading higher to touch the 200-day exponential moving average, which would have been an obvious exit point for many traders who had opened long positions prior to this.

This key moving average then acted as resistance and the price broke below the trendline that indicated the upward trend in August and September, and has continued drifting lower ever since.

EURUSD Price Chart - October 2018

Importance of Pin Bars, Inside Bars, Trendlines and EMA (200)

The real point that I wanted to get across in this article is that if you combine some of the most trusted candlestick patterns with trendlines and key areas of support and resistance, you can get some very powerful trading signals.

That’s exactly what we had with this pair because if you look at the daily price chart of the EUR/USD pair above, you can see all of these things combined to form a powerful reversal signal, and a clear signal to go short.

First of all, the price hit the EMA (200), and if you look at the subsequent price action, you can see that the price struggled to close above this key level.

Secondly, you can see that there was a clear pin bar where the price opened below the EMA (200) and surged higher above 1.1800 during the day’s session, but lacked momentum and dropped back to around its opening price, which was another key signal.

Thirdly, in the few days after this pin bar had formed, the two daily candles traded within the range of the pin bar and both had small bodies, which again indicated a reluctance to take the price higher.

Finally, the price broke below the range of the pin bar (which would have been the perfect time to open a short position), and if you were late to the party, you would have seen that this pair closed below the trendline, which would have given you another good opportunity to open a short position.

The price is now back at around the 1.1500 level. So even if you had entered late, you could have banked up to 170 points so far, which is obviously an excellent return.

Closing Comments

The point is that pin bars, inside bars, key resistance levels and breaks of trendlines are all powerful reversal signals all by themselves, but when they all combine to give the same signal, you end up with a really high probability set-up that is much more likely to be successful.

So it is always worth scanning through the various forex pairs to look for these ultra-strong signals because although they don’t necessarily occur that often, they can be very profitable when they do.

Filed Under: Analysis Tagged With: eurusd, inside bar, pin bar, trendline

Forex Rebates:

Choose from 40+ different forex brokers and crypto exchanges, and get cashback every time you trade:


Copy Profitable Traders:

If you join ZuluTrade, you can follow and subscribe to profitable traders and all of their trades will be automatically copied in your own trading account.

You can also earn money as a signal provider if you are already a profitable trader.

Click here to find out more

Recommended Broker:

Recent Blog Posts:

  • High Probability Trade on S&P 500 – 26 January 2024
  • Oanda Moves Into Prop Trading With Labs Trader Program
  • My eToro Performance in 2023 – Up 33.24%
  • The5ers Offering $20K Bootcamp Challenge For Just $1
  • Example of VWAP Bounce Trade on S&P 500 – 18 December 2023

Recent Articles:

VWAP Indicator
  • MA Sabres (LuxAlgo) Indicator
  • 10 Harsh Truths About Forex Trading
  • Best Websites for Monitoring Currency Strengths
  • Xmaster Formula Indicator for MT4 and MT5
  • Tools:

    Currency Heat Map

    Categories

    • Analysis
    • News

    Archives

    • January 2024
    • December 2023
    • November 2023
    • October 2023
    • September 2023
    • August 2023
    • July 2023
    • June 2023
    • May 2023
    • August 2020
    • June 2020
    • May 2020
    • April 2020
    • January 2020
    • December 2019
    • November 2019
    • October 2019
    • September 2019
    • August 2019
    • July 2019
    • June 2019
    • May 2019
    • April 2019
    • March 2019
    • February 2019
    • January 2019
    • December 2018
    • November 2018
    • October 2018
    • September 2018
    • August 2018
    • July 2018
    • June 2018
    • May 2018
    • March 2016
    • December 2015
    • November 2015
    • October 2015
    • August 2015
    • July 2015

    Disclaimer

    This website should be used for general information purposes only and in no way represents professional financial advice.

    Forex and CFD trading carries a high level of risk and it is possible to lose more than your initial deposit if using leveraged products.

    Copyright © 2025 · eleven40 Pro Theme on Genesis Framework · WordPress · Log in

    • About
    • Contact
    • Disclosure
    • Privacy Policy
    • Terms Of Service