The Forex Chronicles

  • Rebates
  • Brokers
  • News
  • Analysis
  • Signals
    • Best Copy / Social Trading Platforms
    • eToro Review
    • FXTM Invest Review
    • Marketclub Review
    • ZuluTrade Review
  • Indicators
  • Strategies
  • Articles

Dow Jones and Gold Trading Close to Major Resistance Levels

January 18, 2019 by James Woolley Leave a Comment

Previous Analysis

I have been looking at the price of both gold and the Dow Jones index in recent weeks because they have both been trading close to major resistance levels, and are therefore potentially worth shorting.

Since I wrote these two blog posts, nothing much as changed, particularly in the case of gold, but the Dow Jones has continued to move higher, and is now very close to the major resistance levels that I highlighted previously.

So I thought it would be a good idea to take another look at these two markets and make a prediction as to where they might be headed.

Please note that these are only my own personal opinions and do not in any way represent financial or trading advice of any kind.

Gold

I mentioned before that $1300 is acting as a major resistance level at the moment, and that still seems to be the case today:

Gold Price Chart - 18 January

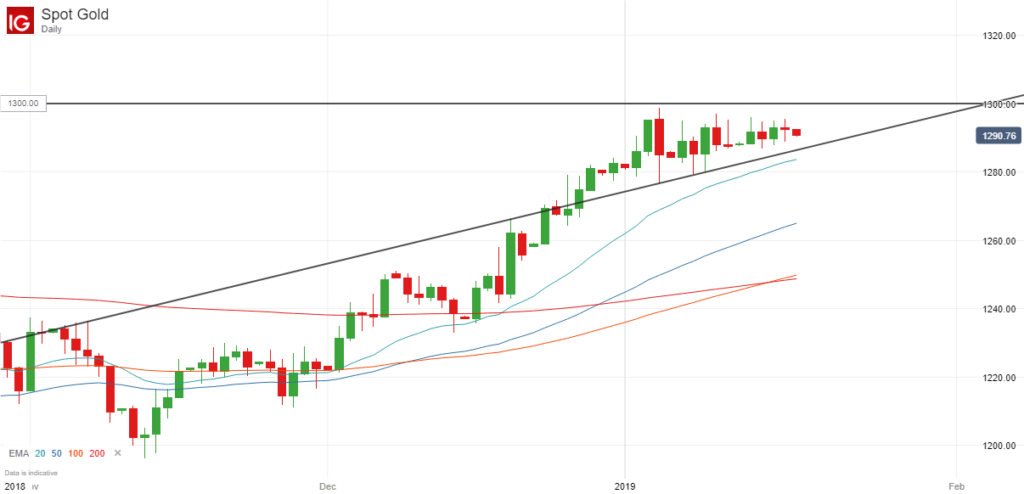
At that time it was trading at $1283, but as you can see from the chart above, the price has slowly edged higher towards the $1300 level since then.

Nevertheless, it has once again stalled in the $1290s as the general stock markets have continued to rise, and as you can see from the chart above, the price has been trading in an ever decreasing triangle.

Therefore I personally think that it is only a matter of time before we see a breakout, and the likelihood is that it will be a downward one because of the continual round number resistance at $1300 and the tight price action.

So it wouldn’t be at all surprising if the price were to move back to around $1250-$1260, towards the 100 and 200-day moving averages, but if the price was to go back to $1300, it may also be worth opening a short here because I think this would be a fairly high probability set-up as well.

Dow Jones

As mentioned earlier, the Dow Jones has continued to recover from its December lows, and this isn’t really that surprising.

I said in a previous post that the price could easily continue moving higher and test its long-term moving averages, which at that time stood at 24,507 (EMA (100)) and 24,741 (EMA (200)), and at the time of writing, the price is now trading at 24,406 pre-market opening.

Dow Jones Chart - 18 January

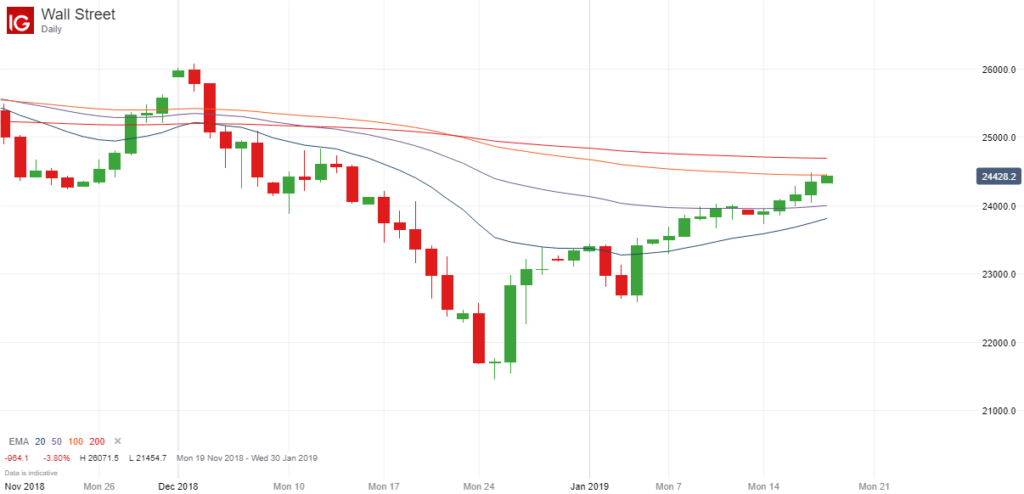
Indeed it has just touched the EMA (100) yesterday and today, having risen sharply from a low of 21,454, so it is now looking seriously overbought and could now be ready to turn lower now that it has reached two major resistance levels (the EMA (200) is just 280 points higher).

As always, the market never gives you a clear signal that a top or a bottom has been reached, but with the price trading close to two key moving averages, I think it could be a good opportunity to open a short position if we get a pin bar on the daily chart or one of the lower time frames, for example, because this would also be a high probability set-up.

Filed Under: Analysis Tagged With: dow jones, gold, resistance

GBP/USD Analysis – The Importance of the EMA (200)

October 26, 2018 by James Woolley Leave a Comment

Introduction to the EMA (200)

The 200-day exponential moving average, or EMA (200) for short, actually has a lot of importance in the world of trading.

When the price breaks upwards through the EMA, it is often a sign of strength, but more significantly, when the EMA (50) crosses upwards through the EMA (200), it is a much stronger signal to go long.

Similarly, when the EMA (50) crosses below the EMA (200), it is referred to as a death cross, and gives a strong signal to go short.

However it is important to note that the EMA (200) is often a key support or resistance level, whereby the price will touch this line, before reversing in the opposite direction.

Many people are sceptical about the importance of such indicators, but you only need to look at the daily chart of the GBP/USD pair to see how the price reacted when it touched the 200-day moving average:

GBPUSD EMA (200) Resistance - October 2018

GBP/USD Sell-Off

The red line indicates the EMA (200) in the chart above, and you can see that the price touched this key indicator on four separate days, and came close to it on one other day as well, but on every occasion the pair was met with a wave of selling that drove the price back below this indicator.

Similarly, this indicator will have acted as a target price to take profits for any people who were long on this pair, so this too would have helped force the price down.

Final Thoughts

The point I want to make is that this 200-day exponential moving average is always worth including on your daily price charts because it is a good place to take profits, and is a good level to watch because it often acts as a key support or resistance level.

Similarly if the price goes straight through it and the EMA (50) later crosses through it as well, it is often seen as a very strong signal that a new trend has emerged. Therefore you should consider looking for opportunities to get in on this trend at a good price when this occurs.

Filed Under: Analysis Tagged With: gbpusd, resistance, support

$80 Acting As Strong Resistance For Brent Crude Oil

September 14, 2018 by James Woolley Leave a Comment

Brent Crude Price Action (2016-2018)

The price of Brent Crude dropped below $30 back in 2016, resulting in sharp share price falls for all of the listed oil companies.

Since then the price of Brent oil has risen steadily over time, and although it is nowhere near its all-time highs, it now stands at $78.18, which is a very strong recovery. As you might expect, the share price of all of the major oil companies has risen sharply as a result, and many oil traders have made some decent profits as well.

Recent Price Action

From a trading perspective, the long-term history of the Brent Crude oil price doesn’t matter too much, but if you look at how this commodity has traded in 2018, the price action is a lot more significant and could affect how you trade in the future.

That’s because it is clear that $8000 has acted as strong resistance on several occasions since May, and continues to act as resistance even now in September 2018.

Brent Crude Oil Chart - September 2018

Just a few days ago the price hit a high of $79.89, but was quickly sold off shortly afterwards, and the daily candle ended up being a doji candle, which indicates indecision and a lack of momentum to take it higher.

Subsequently when the price dropped below the low of this doji candle the following day, this was a good opportunity to open a short position and trade the downward breakout.

Furthermore, on the rare occasions that the price has risen above $80, it has never actually closed above this level at any point.

The Significance of $80

Before I discuss possible trading opportunities, I just want to discuss the significance of round numbers once again.

There are some traders who don’t believe that these round numbers carry much weight, but in my experience these numbers are highly important and will often act as a strong support or resistance level.

As a result of this, you will often see the price reverse at these key levels, and this certainly seems to be the case here because this commodity is quickly sold off any time it gets close to this critical $80 level.

Trading Opportunities

One obvious way to trade this reoccurring trading pattern is to simply enter short positions at $80 or just below, such as $79.50 or $79.75, for example.

However I don’t necessarily like this plan because at some point the price is likely to break through this $80 level (and close above this level), which will encourage traders to go long and push the price higher, and trigger your stop loss.

A better approach is to pay attention to the candlesticks that form and try and trade the price action. For example, if there is a doji bar, like there was yesterday, you can enter short positions if the price drops below the low of this candle because this is a high probability trade that will often generate decent returns, particularly if you close half the position early for 30-50 points, for instance, move your stop loss to break even and let the other half run for as long as possible.

Similarly, if there is a large candlestick when the price gets close to $80, followed by at least two or three inside bars, you could wait for the price to close below the initial set-up bar before entering a new short position because this will signify that there is a downward breakout.

The point is that you should pay attention to these key levels of support and resistance because the markets will pay close attention to them and trade accordingly. Therefore the resulting price reversals can be both predictable and profitable to trade if you get the right set-ups.

Filed Under: Analysis Tagged With: brent crude, brent crude oil, resistance

EUR/USD Approaching Strong Resistance Level At 1.1700

August 27, 2018 by James Woolley Leave a Comment

Previous Price Breakout

I have posted a few trading updates about the EUR/USD pair just recently, and as you may recall, I pointed out that it was worth watching out for a possible breakout when the price was trading in a very narrow channel.

Well the price did in fact drop below this channel and although it did pull back a little, it did subsequently drop around 280 points from the closing price of the initial breakout candle.

Since then the price of the EUR/USD pair has rallied somewhat and is now back to where it was before this downwards breakout. So where does the price go from here?

Resistance at 1.1700

Well if we keep the same trendlines on the chart from last time, it is clear that there is strong resistance at these levels.

EURUSD Price Resistance At 1.1700

First of all, the upward and downward trendline from the previous channel act as resistance, but you will also notice that the EMA (100) is sitting just above this trendline at around 1.1700.

So when you also consider that these round numbers often act as strong support and resistance levels, it is clear that it is going to be hard for the price to break through this level in the coming days.

Trading Opportunities

At the time of writing, the price of the EUR/USD has reached a high of just over 1.1650 at the start of the overnight trading session (check out the last blog post to read about a trader who has managed to develop a highly profitable overnight trading strategy for the EUR/USD pair), but has subsequently dropped back to 1.1600. So it has already been sold off after approaching this resistance level.

Therefore if the price moves above 1.1650 towards the critical 1.1700 level once again, a short position might be a high probability trading opportunity that is worth taking because the price is unlikely to have the momentum to break through this level.

Alternatively, it might be worth watching just to see how the price reacts and then opening a position accordingly.

For example, if the price is sold off once again, you might want to think about opening a short position between 1.1600 and 1.1650, but if the price does actually break strongly upwards through the 1.1700 level, it might be worth opening a long position and trading a possible upward breakout because this is quite a strong level of resistance.

Disclaimer: These are just my own personal thoughts and doesn’t in any way represent financial advice. You should always do your own research and make your own decisions when trading forex.

Filed Under: Analysis Tagged With: eurusd, resistance

Forex Rebates:

Choose from 40+ different forex brokers and crypto exchanges, and get cashback every time you trade:


Copy Profitable Traders:

If you join ZuluTrade, you can follow and subscribe to profitable traders and all of their trades will be automatically copied in your own trading account.

You can also earn money as a signal provider if you are already a profitable trader.

Click here to find out more

Recommended Broker:

Recent Blog Posts:

  • High Probability Trade on S&P 500 – 26 January 2024
  • Oanda Moves Into Prop Trading With Labs Trader Program
  • My eToro Performance in 2023 – Up 33.24%
  • The5ers Offering $20K Bootcamp Challenge For Just $1
  • Example of VWAP Bounce Trade on S&P 500 – 18 December 2023

Recent Articles:

VWAP Indicator
  • MA Sabres (LuxAlgo) Indicator
  • 10 Harsh Truths About Forex Trading
  • Best Websites for Monitoring Currency Strengths
  • Xmaster Formula Indicator for MT4 and MT5
  • Tools:

    Currency Heat Map

    Categories

    • Analysis
    • News

    Archives

    • January 2024
    • December 2023
    • November 2023
    • October 2023
    • September 2023
    • August 2023
    • July 2023
    • June 2023
    • May 2023
    • August 2020
    • June 2020
    • May 2020
    • April 2020
    • January 2020
    • December 2019
    • November 2019
    • October 2019
    • September 2019
    • August 2019
    • July 2019
    • June 2019
    • May 2019
    • April 2019
    • March 2019
    • February 2019
    • January 2019
    • December 2018
    • November 2018
    • October 2018
    • September 2018
    • August 2018
    • July 2018
    • June 2018
    • May 2018
    • March 2016
    • December 2015
    • November 2015
    • October 2015
    • August 2015
    • July 2015

    Disclaimer

    This website should be used for general information purposes only and in no way represents professional financial advice.

    Forex and CFD trading carries a high level of risk and it is possible to lose more than your initial deposit if using leveraged products.

    Copyright © 2025 · eleven40 Pro Theme on Genesis Framework · WordPress · Log in

    • About
    • Contact
    • Disclosure
    • Privacy Policy
    • Terms Of Service