The Forex Chronicles

  • Rebates
  • Brokers
  • News
  • Analysis
  • Signals
    • Best Copy / Social Trading Platforms
    • eToro Review
    • FXTM Invest Review
    • Marketclub Review
    • ZuluTrade Review
  • Indicators
  • Strategies
  • Articles

Multi-Timeframe and Divergence Oil Trade – 7 December 2023

December 8, 2023 by James Woolley Leave a Comment

Introduction

I’ve been asked several times to document some trades that are based on multi-timeframe analysis because people seem to really resonate with this particular trading strategy, so in today’s article I want to discuss a very nice set-up that occurred on US crude oil yesterday afternoon.

With multi-timeframe analysis I like the weekly, daily and 4-hour charts to be trending in the same direction, with the price ideally above or below their 10 and 20-period moving averages on each one.

Then I want to see a pullback on the 1-hour chart followed by a trend resumption in alignment with the three longer term charts, which is where I will enter a position.

US Crude Oil Set-Up

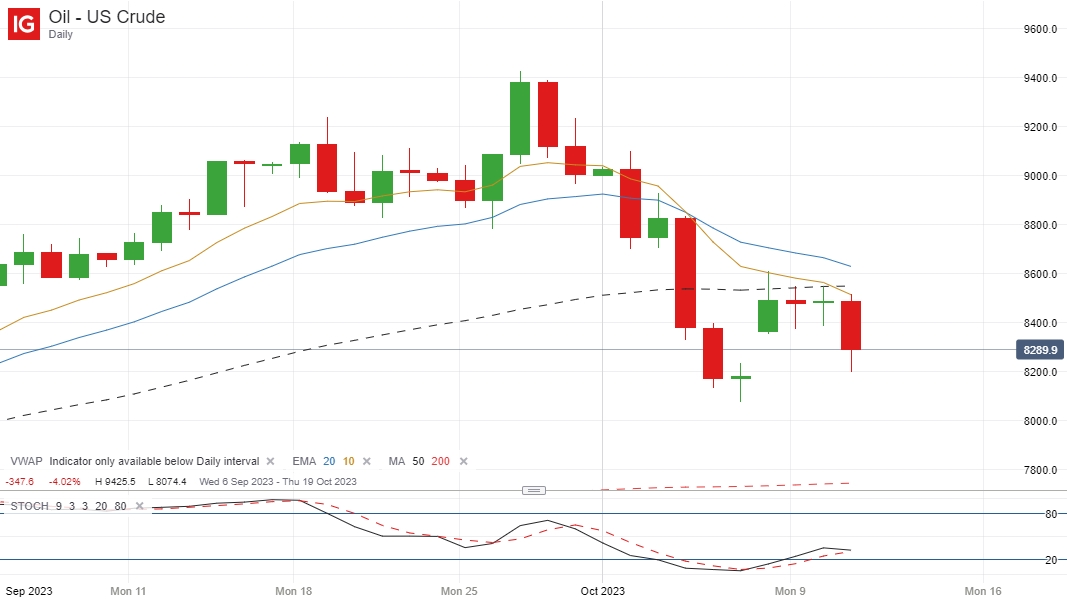
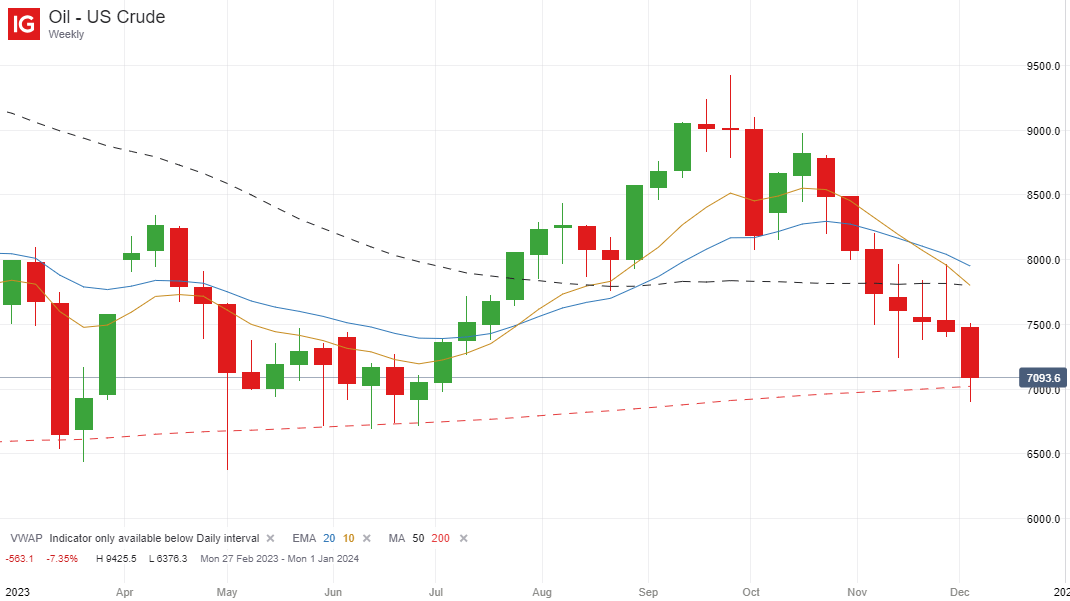
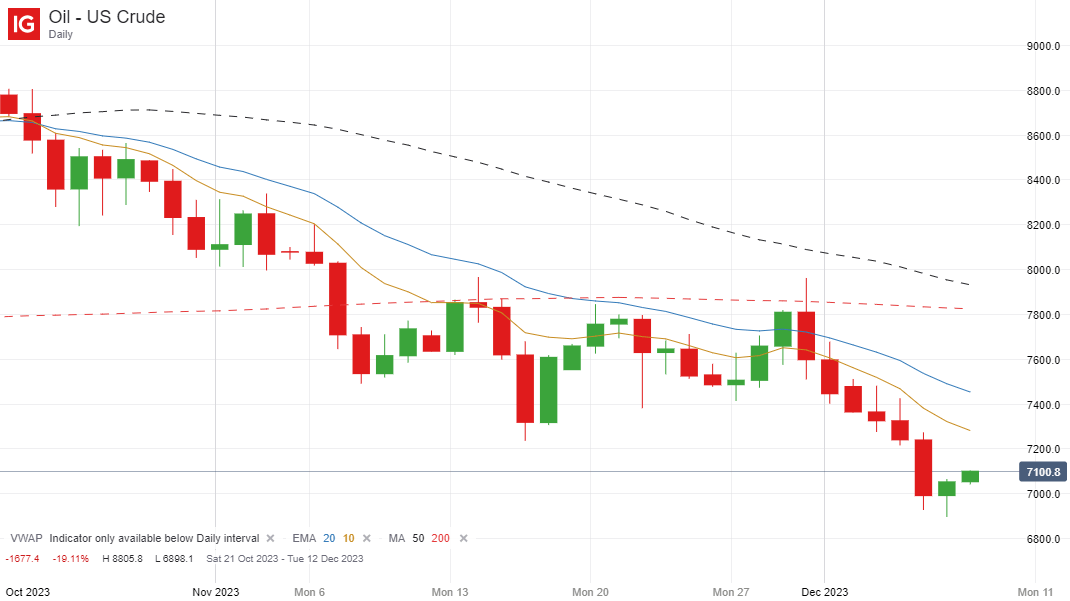
In the case of US crude oil, the price has been trending downwards on the weekly and daily chart for a while now, and was showing a little more strength on the 4-hour chart. However it was still trading below my preferred moving averages (the 10 and 20 EMA) on this timeframe too, as you can see below:

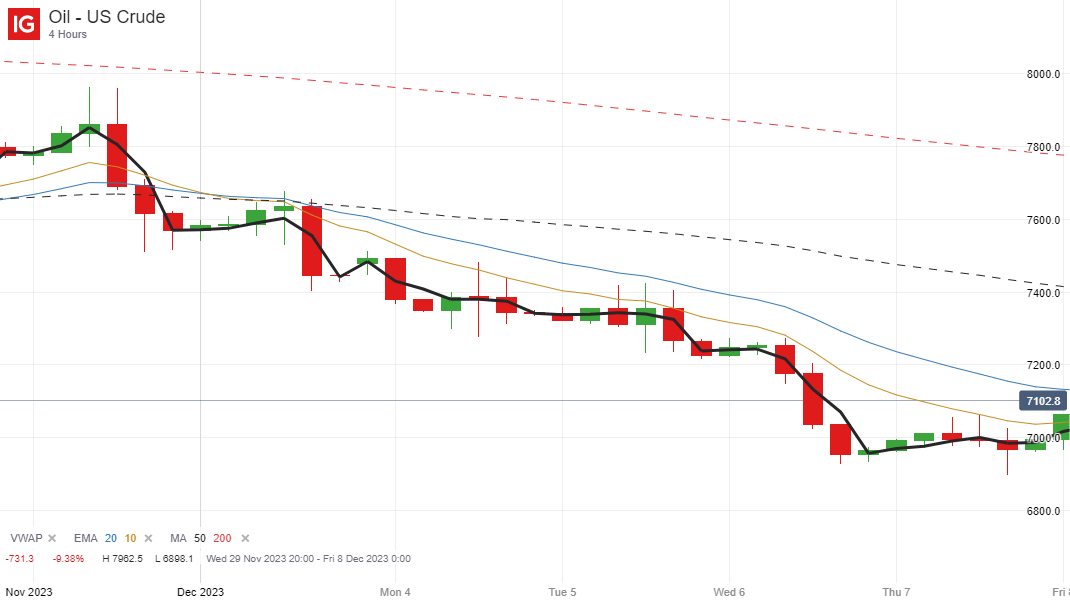
This is exactly what I was hoping to see, and it was actually perfectly set-up for a 1-hour pull-back and entry on Wednesday, but I was reluctant to trade on that day because the crude oil inventories figure was due to be released later in the afternoon, and could have had a positive or a negative effect on the trade.

As it turned out, this would have been a very profitable trade as it moved strongly downwards prior to the data release, but luckily there was another nice set-up on Thursday where the price resumed its downward trend after a brief pullback.

Trade Entry

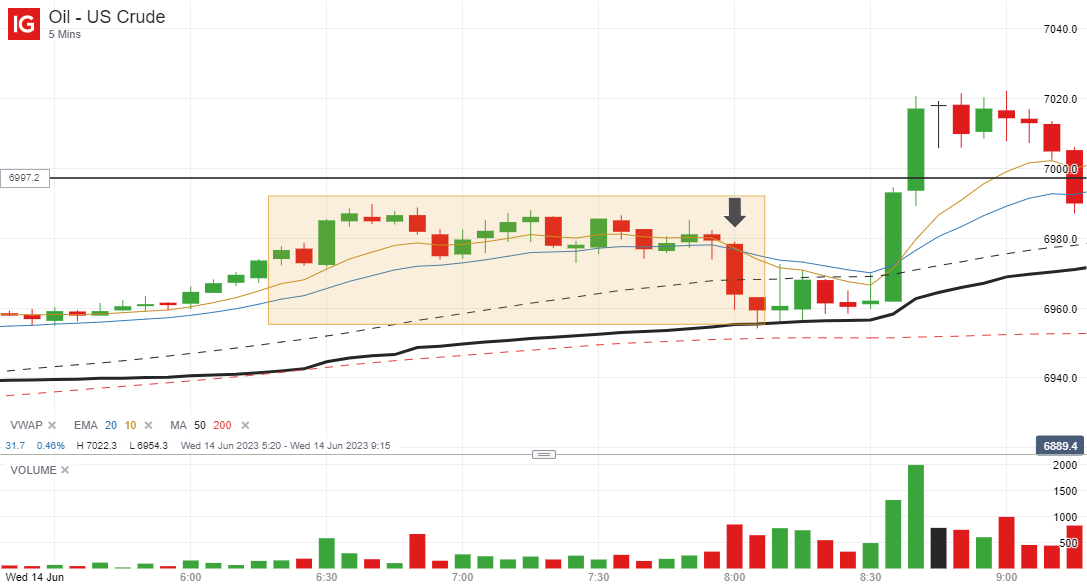
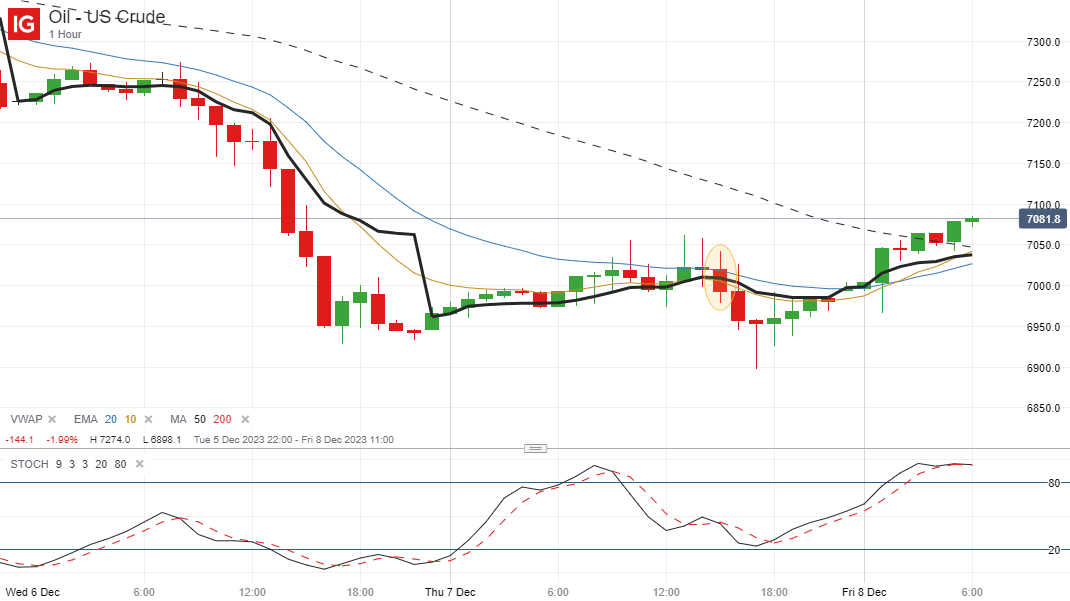
As you can see, there were actually two potential set-ups earlier in the day, at the close of the 5.00 and 11.00 candles, but these were low probability trades because they occurred during the quietest periods of the day when volume for US crude oil is very light. So there was unlikely to be any strong momentum behind any downward move even if the trend were to continue.

The close of the highlighted 3PM candle was a much better set-up even though it was a little late in the day because it was a bigger downward candle and there was a lot more volume behind the price drop because it occurred in the first few hours of the US session.

Furthermore, if you look at the stochastics indicator in the bottom panel of the chart, you will see that there was a nice double top divergence pattern that showed that this upward price move was running out of momentum. Plus it also dropped below the black VWAP indicator as well to give a very strong signal.

If you had entered a short position at the close of the 3 PM candle (at 4 PM) at 69.927, you would have watched it move against you initially, but then fall as low as 68.98, approximately 95 points in profit, before bouncing back slightly towards the end of the day.

Since then it has continued moving higher in the overnight Asian session, but that doesn’t really matter. It still gave you enough of a move to bank some nice profits, even if you closed half the position at 50 points and were stopped out at break-even with the other half, for example.

Final Thoughts

Hopefully I have now demonstrated that this multi-timeframe strategy works well on a variety of different instruments because I have now given trading examples of this strategy for oil, gold and the USD/JPY pair.

You do still need to be selective, as I highlighted above, because you don’t want to take an entry signal at the quieter periods of the day. If you have strong volume on your side and are trading in alignment with the prevailing trend on the higher time frames, your odds of success will be much higher.

Filed Under: Analysis Tagged With: oil, us crude

Inside Bar Breakout Trade on US Crude Oil – 11 October 2023

October 11, 2023 by James Woolley Leave a Comment

Trade Set-Up

The tragic events that took place in Gaza over the weekend unsurprisingly caused the price of oil to spike sharply upwards on Sunday evening and into the early hours of Monday morning.

However after hitting a high of $86.11, the price of US crude oil price subsequently dropped back, and much to the surprise of many oil traders, it did in fact trade sideways in a fairly subdued manner on Monday and Tuesday.

This set up an excellent trading opportunity for breakout traders because if you check out the daily chart below, you will see that there was a double inside bar set-up, with both bars trading within the range of Sunday’s bar, which is generally a high probability set-up:

Trade Execution

When you get a set-up like this, you can either wait for the price to break the high of Tuesday’s candle to go long, or wait for the price to break the low to go short.

For extra confirmation, you can wait for a breakout on a lower timeframe, followed by a retest and then a continuation breakout, but by doing this, you run the risk of missing the trade altogether if the price drives straight through the high or the low without pulling back to the entry level.

A lot depends on the pre-breakout price action. Ideally you want the price to consolidate near the breakout level for several candles, because then the price has the potential to move a lot further from the breakout level straight away, but this didn’t occur here.

Anyone taking the breakout on the 5-minute price chart, for example, would have noticed that there was a lot of choppy price action after the initial breakout, as well as a few price moves back above $84.00 that may have taken them out before the big drop lower occurred if they used a relatively tight stop loss on this lower timeframe.

That’s why it’s often better just to stick to the daily chart when trading inside bar breakouts, reduce your trade size and use wider stop losses instead.

If you had done that here, you could have entered a short position on the breakout, placed your stop loss at yesterday’s high and still banked an excellent profit based on a 1:1 risk reward, without having to worry about short-term volatility.

Indeed you wouldn’t have even seen this initial volatility on the daily chart if you were looking at the chart at the end of the day.

Closing Comments

I didn’t take this trade myself because I was away from my computer this afternoon, but I just wanted to discuss this set-up on US crude oil because you don’t see these double inside bars very often, particularly on a volatile market such as oil.

However they are always worth paying attention to because when the price does eventually break the high or the low of the most recent inside bar, you can get some very big price moves in the direction of the breakout, as was the case here with a price drop of over 180 points from the breakout level.

Filed Under: Analysis Tagged With: breakout, inside bar, oil, us crude

Opening Range Breakout on US Crude Oil – 14 June 2023

June 14, 2023 by James Woolley Leave a Comment

Introduction

Opening range breakouts can be some of the easiest and most profitable trades to execute when you get some good set-ups, and today we had a textbook set-up on the US crude oil market.

I like to wake up and start scanning my charts around 7 AM UK time, and as we got closer to 8 AM, it was apparent that US crude had been trading in a very tight sideways range since around 6.15 and was poised to break out of this range, either upwards or downwards, once the London market opened.

With the price hovering just above the 10 and 20-period EMAs on the 5-minute chart, and bearing in mind that we were sitting right on yesterday’s high, I wanted to see a downwards break, and that’s exactly what happened:

Trade Execution

With this type of set-up, it is best to either enter a trade on the 1-minute chart or enter a position based on pure price action.

That’s because if you wait for the 5-minute breakout candle to close, you will often find that a large part of the move will have taken place already, and subsequently you will be entering too late.

I myself did the latter and entered a short position straight after the London market opened when I saw the price starting to tick down fast, getting in at 6973.7, ie $69.737.

I placed my stop loss at the high of the previous 5-minute candle at 6982.3, 8.6 points away, and I was initially planning to exit half the position at VWAP, approximately 18 points away and indicated by the thick black line on the chart, and then let the other half run in case the price blasted straight through it.

As you can see, the VWAP ended up acting as support as it so often does, and after closing half the position at VWAP, the price came right back up and nearly took me out at break-even.

However thankfully the price came back down and I eventually decided to close the other half out at VWAP once again when I had the chance because it wasn’t acting right.

So the total profit from this trade was around 18 points, representing a reward to risk of over 2 to 1, which I am always more than happy with.

After all, if you can find risk-reward trades of 1-2 (trades that return 2 points of profit for 1 point of risk), if they only work out 40% of the time, for example, you will still earn some decent profits in the long run.

Closing Comments

The main point I wanted to get across is that the opening few hours of the London trading session can be very profitable if you like to trade opening range breakouts.

The key is to find markets that have traded in a very narrow range leading up to the open because in the case of US crude, for example, we know from my last post that it trades in a range of around 236 points on average at the moment.

Therefore when it traded in a 30-point box from 6.15 to 8.00 AM UK time, something had to give. It was inevitable that we would see a breakout. All I had to do was be patient and jump on board when it eventually happened.

Of course there will be false breakouts from time to time, but when this occurs, the secondary breakout will often be the one that cancels out the initial loss and brings in the big money.

So always try to look out for sideways consolidations in otherwise volatile markets because the price is very unlikely to stay in this tight range for very long.

Filed Under: Analysis Tagged With: breakout, oil, opening range breakout, us crude

Crude Oil’s Price Move Highlights Profitability of Inside Bar Breakouts

January 10, 2019 by James Woolley 1 Comment

Inside Bar Breakouts

I have long argued that inside bar breakouts are some of the easiest and most predictable breakouts that you can trade.

All you need to do is wait for quite a large candle on the daily chart (or higher), and wait for a series of consecutive inside bars that all trade within the range of this initial candle.

Then once the price eventually closes above or below the initial candle, you can then enter a trade in the same direction, and profit from the momentum of the breakout.

Real Life Example – US Crude Oil

To demonstrate the effectiveness of this simple trading strategy, here is the daily chart of US crude oil that I posted on this website at the start of the month:

US Crude Oil Inside Bars - 1 January 2019

….. and this is what happened when the price finally closed outside of the range of the initial set-up candle:

US Crude Oil Breakout - January 2019

As you can see, there was initially a false breakout where the price moved above but failed to close above the initial candle, followed by a secondary breakout where the price did indeed close above this candle, and this would have been the time to enter a long position.

Once this happened, the price moved strongly higher and went straight to $50, which would have been a natural exit price, but it actually had the momentum to keep on moving higher, and currently stands at around $52.

It could potentially go higher as well because it is still quite a long way below both the 100 and the 200-day moving averages, as shown on the chart above.

Final Thoughts

So hopefully you can see that you don’t necessarily need to use lots of fancy indicators to come up with a winning strategy.

The simplest strategies are often the most profitable, and I always found that inside bar breakouts in particular are generally some of the most predictable and profitable breakouts that you can trade.

The only real drawback is that they don’t occur all that often. So you may have to wait patiently for a really good set-up to occur across all of the major forex pairs and commodities. Alternatively you can apply this strategy to some of the other markets that you like to trade, such as cryptocurrencies or ETFs, for example.

Filed Under: Analysis Tagged With: breakout, inside bar, oil, us crude

US Crude Oil Update – 1 January 2019

January 1, 2019 by James Woolley Leave a Comment

Previous Breakout

A few weeks ago I highlighted a possible breakout that was shaping up on the daily chart of US crude oil, and as it turned out, this would have been a very profitable trade:

US Crude Oil Breakout - December 2018

After breaking out of the previous trading range and closing below the lower trendline, the price went from around $49.50 to as low as $42.44 in a relatively short period of time.

Inside Bars

Since then, the price has recovered somewhat and is now trading around the $45 – $46 level, having moved relatively little during this quiet Christmas and New Year period.

However it is interesting to note that an inside bar formation has formed on this same daily chart, which suggests that there may be a possible breakout in the next few days.

US Crude Oil Inside Bars - 1 January 2019

What I am basically saying is that after the large bullish candle on 26 December 2018, there have been 3 consecutive inside bars / candles (4 if you include the Sunday session) that have all traded within the range of this particular candle.

Trading Opportunity

This is often a very good set-up if you are looking to trade breakouts because traders will often spot the same breakout themselves and pile into a position once the price closes above or below the initial set-up candle, helping it to become a self-fulfilling breakout for everyone.

In this case, an upward breakout is looking more likely simply because it is trading closer to the high of the initial candle, and we are long overdue a bounce as the price of oil dropped so much last year.

Therefore if the price closes above $47.08 in the coming days without closing too far above this level, this could be a good opportunity to open a long position.

$50 would be an obvious resistance level, so it might be a good idea to target an exit price just below $50, but if it could break through this level, then the price could potentially surge towards the 100 and 200-day EMAs, which are currently at $57.76 and $61.26 respectively.

I personally think the first outcome is more likely because I think it will struggle to break through the $50 at the current time.

If the price doesn’t close above the high of the initial candle and instead breaks below the low of this candle, and indeed the low of the previous candle a few days earlier, then this will really open up the downside.

This would see the price drop to around $42, and if it closed around this level, you could then expect the price to fall below $40 fairly easily.

However at the moment we just have to wait and see what happens. What I will say is that the longer the price trades within the range of the initial set-up candle, the stronger the breakout is likely to be.

As always, please note that these are just my own thoughts and opinions. This doesn’t represent professional trading or financial advice in any way.

Filed Under: Analysis Tagged With: breakout, oil, us crude

  • 1
  • 2
  • Next Page »

Forex Rebates:

Choose from 40+ different forex brokers and crypto exchanges, and get cashback every time you trade:


Copy Profitable Traders:

If you join ZuluTrade, you can follow and subscribe to profitable traders and all of their trades will be automatically copied in your own trading account.

You can also earn money as a signal provider if you are already a profitable trader.

Click here to find out more

Recommended Broker:

Recent Blog Posts:

  • High Probability Trade on S&P 500 – 26 January 2024
  • Oanda Moves Into Prop Trading With Labs Trader Program
  • My eToro Performance in 2023 – Up 33.24%
  • The5ers Offering $20K Bootcamp Challenge For Just $1
  • Example of VWAP Bounce Trade on S&P 500 – 18 December 2023

Recent Articles:

VWAP Indicator
  • MA Sabres (LuxAlgo) Indicator
  • 10 Harsh Truths About Forex Trading
  • Best Websites for Monitoring Currency Strengths
  • Xmaster Formula Indicator for MT4 and MT5
  • Tools:

    Currency Heat Map

    Categories

    • Analysis
    • News

    Archives

    • January 2024
    • December 2023
    • November 2023
    • October 2023
    • September 2023
    • August 2023
    • July 2023
    • June 2023
    • May 2023
    • August 2020
    • June 2020
    • May 2020
    • April 2020
    • January 2020
    • December 2019
    • November 2019
    • October 2019
    • September 2019
    • August 2019
    • July 2019
    • June 2019
    • May 2019
    • April 2019
    • March 2019
    • February 2019
    • January 2019
    • December 2018
    • November 2018
    • October 2018
    • September 2018
    • August 2018
    • July 2018
    • June 2018
    • May 2018
    • March 2016
    • December 2015
    • November 2015
    • October 2015
    • August 2015
    • July 2015

    Disclaimer

    This website should be used for general information purposes only and in no way represents professional financial advice.

    Forex and CFD trading carries a high level of risk and it is possible to lose more than your initial deposit if using leveraged products.

    Copyright © 2026 · eleven40 Pro Theme on Genesis Framework · WordPress · Log in

    • About
    • Contact
    • Disclosure
    • Privacy Policy
    • Terms Of Service
    We use cookies to ensure that we give you the best experience on our website. If you continue to use this site we will assume that you are happy with it.OK