The Forex Chronicles

  • Rebates
  • Brokers
  • News
  • Analysis
  • Signals
    • Best Copy / Social Trading Platforms
    • eToro Review
    • FXTM Invest Review
    • Marketclub Review
    • ZuluTrade Review
  • Indicators
  • Strategies
  • Articles

Double Pin Bar on USD/CAD at Start of September

September 9, 2019 by James Woolley Leave a Comment

Introduction to Pin Bars

I was listening to a podcast over the weekend and one of the traders being interviewed said that despite having about three core strategies that she likes to use, it is the simple pin bar that often provides her with the best signals.

To remind you, a pin bar is essentially where you have a long candlestick with a very small body, and when you get these pin bars towards the end of an upward or downward trend, it often signals that the trend is running out of momentum and likely to reverse.

One pin bar by itself often provides a very good trend reversal signal, but when you get two pin bars together, it is often a very strong signal that the trend is coming to an end.

Real-Life Example From USD/CAD Pair

I was reminded of this just recently when I was looking at the daily chart of the USD/CAD pair. As you can see below, the price has been recovering strongly since the middle of July, and has recently crossed above the 200-day moving average:
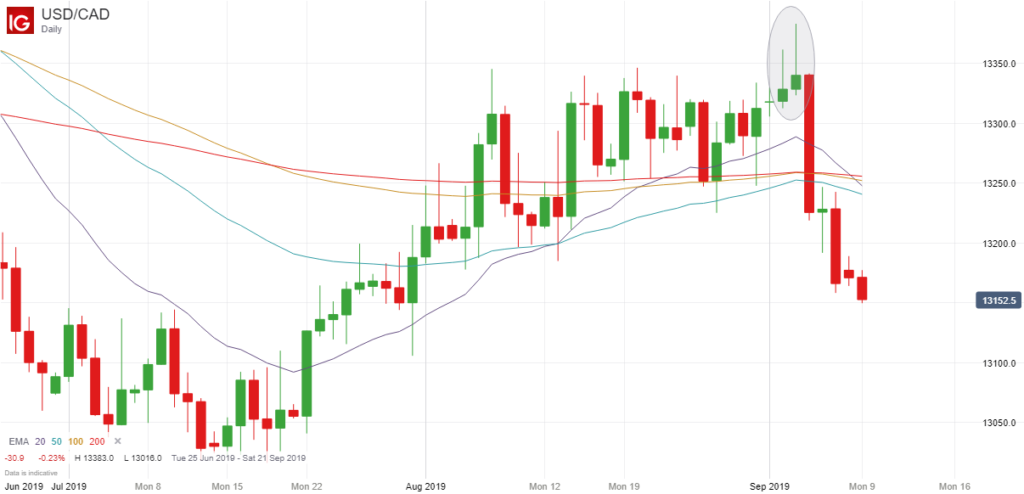
USDCAD Double Pin Bar - September 2019

More significantly, it also threatened to break even higher last week after being stuck in quite a narrow trading range for a number of weeks, but after posting two new highs on consecutive days, the price fell back down on both occasions and ended up forming a pin bar on both days.

Trading Opportunity

As a result of this double pin bar formation, there was a good opportunity to place an order to open a short position a few pips below the lowest point of these two pin bars at around 1.3310 to catch any reversal, and as it turned out, this would have been a very profitable trade.

At the time of writing, the USD/CAD is trading at around 1.3150, which equates to around 160 points profit if you had entered a short position just below the lowest point of the two pin bars.

Final Thoughts

The point of this article was not simply to highlight a profitable set-up that you might have missed. It was to demonstrate how profitable these double pin bar set-ups can be when they actually occur.

Unfortunately they don’t tend to occur very often, so you won’t necessarily be able to trade these high-probability set-ups several times a month, for example, but it is worth keeping an eye out for them, particularly on the longer time frames when the odds of success are so much higher.

What I like about pin bars, and double pin bars in particular, is that there is an obvious place to place your stop loss – a few pips above the highest point of the two pin bars, as in this case, or a few pips below the lowest point in a downward trend.

The difficult part is trying to work out where you should take profits because sometimes you can get a large reversal, as was the case here with the USD/CAD pair, whereas other times the price may only move 10-20 pips before consolidating in the previous trading range or continuing its previous trend.

Therefore it could be argued that the best pin bar strategy is to close half the position for a small profit and let the other half run for as long as possible, but everyone will have their own methods of trading these high-probability set-ups. Ultimately you just have to find a strategy that works for you.
Filed Under: Analysis Tagged With: pin bar, usdcad

USD/CAD Symmetrical Triangle Chart Pattern For August 2018

August 21, 2018 by James Woolley Leave a Comment

Triangle Chart Patterns

It can be very useful to draw trendlines connecting the highs and the lows to see the underlying trend, and to spot any potential breakout opportunities that may be available.

Sometimes you will get ascending triangles and sometimes you will get descending triangles, but where there has been a sideways trading range, you will often see symmetrical triangles where the price is trading in an ever decreasing trading range / triangle.

This is beneficial for traders because the price has to eventually break upwards or downwards out of this triangle at some point, and when it does it often results in a strong breakout.

Symmetrical Triangle on USD/CAD Pair

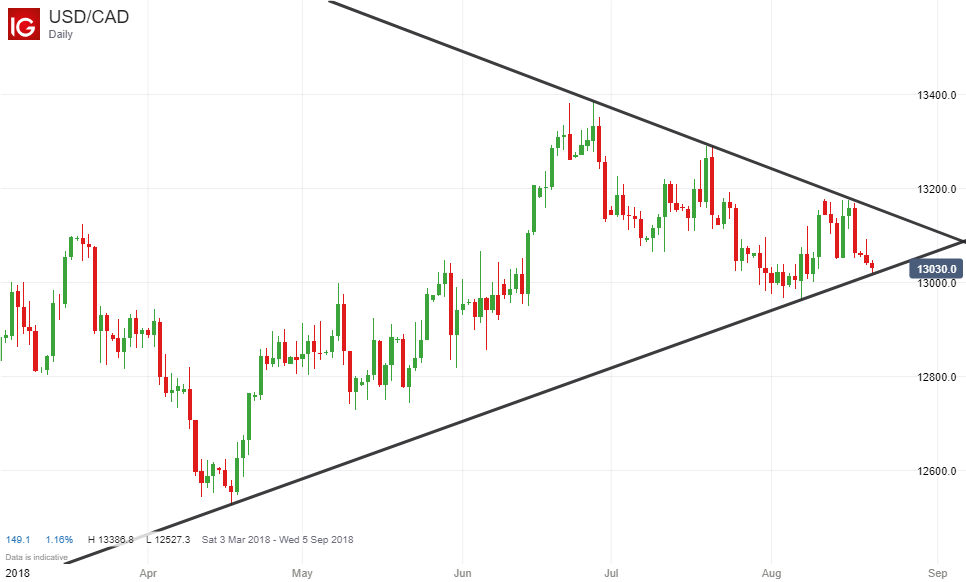
You may be interested to know that there is a classic symmetrical triangle pattern on the daily chart of the USD/CAD pair right now.

USDCAD Symmetrical Triangle - August 2018

This pair has been in a slight upward trend since September 2017, but has been trading in quite a narrow sideways trading range this summer with little upward or downward momentum, which is why we now have this triangle pattern.

Potential Trade

As a result, it might be worth keeping a close eye on the daily price chart of the USD/CAD pair because it is getting very close to the lower trendline at the moment, and may be about to close below this trendline either today or in the coming days.

Therefore it could be a good time to open a new short position if the price does close strongly below this trendline because there could be a strong downward move in the following days and weeks.

As always, I am not recommending any trades. There is always the chance that any breakout could turn out to be a false one.

I am just sharing with you my thoughts and demonstrating how you can trade any breakouts that occur when the price breaks out of a symmetrical triangle pattern.

Filed Under: Analysis Tagged With: breakout, symmetrical triangle, usdcad

Forex Rebates:

Choose from 40+ different forex brokers and crypto exchanges, and get cashback every time you trade:


Copy Profitable Traders:

If you join ZuluTrade, you can follow and subscribe to profitable traders and all of their trades will be automatically copied in your own trading account.

You can also earn money as a signal provider if you are already a profitable trader.

Click here to find out more

Recommended Broker:

Recent Blog Posts:

  • High Probability Trade on S&P 500 – 26 January 2024
  • Oanda Moves Into Prop Trading With Labs Trader Program
  • My eToro Performance in 2023 – Up 33.24%
  • The5ers Offering $20K Bootcamp Challenge For Just $1
  • Example of VWAP Bounce Trade on S&P 500 – 18 December 2023

Recent Articles:

VWAP Indicator
  • MA Sabres (LuxAlgo) Indicator
  • 10 Harsh Truths About Forex Trading
  • Best Websites for Monitoring Currency Strengths
  • Xmaster Formula Indicator for MT4 and MT5
  • Tools:

    Currency Heat Map

    Categories

    • Analysis
    • News

    Archives

    • January 2024
    • December 2023
    • November 2023
    • October 2023
    • September 2023
    • August 2023
    • July 2023
    • June 2023
    • May 2023
    • August 2020
    • June 2020
    • May 2020
    • April 2020
    • January 2020
    • December 2019
    • November 2019
    • October 2019
    • September 2019
    • August 2019
    • July 2019
    • June 2019
    • May 2019
    • April 2019
    • March 2019
    • February 2019
    • January 2019
    • December 2018
    • November 2018
    • October 2018
    • September 2018
    • August 2018
    • July 2018
    • June 2018
    • May 2018
    • March 2016
    • December 2015
    • November 2015
    • October 2015
    • August 2015
    • July 2015

    Disclaimer

    This website should be used for general information purposes only and in no way represents professional financial advice.

    Forex and CFD trading carries a high level of risk and it is possible to lose more than your initial deposit if using leveraged products.

    Copyright © 2025 · eleven40 Pro Theme on Genesis Framework · WordPress · Log in

    • About
    • Contact
    • Disclosure
    • Privacy Policy
    • Terms Of Service