The Forex Chronicles

  • Rebates
  • Brokers
  • News
  • Analysis
  • Signals
    • Best Copy / Social Trading Platforms
    • eToro Review
    • FXTM Invest Review
    • Marketclub Review
    • ZuluTrade Review
  • Indicators
  • Strategies
  • Articles

USD/JPY Multi-Timeframe Trade Example – 8 November 2023

November 8, 2023 by James Woolley 3 Comments

Introduction to Multi-Timeframe Trading Strategies

The golden rule of trading is to always trade with the trend because this will tilt the odds in your favor and give you a greater chance of success in the long run.

The problem is that a currency pair could be trending upwards on one timeframe and trending downwards on another.

The solution to this is to look at multiple time frames, and more specifically, you want to find a pair that is trending upwards on two or three longer term timeframes to confirm that the underlying trend is bullish, and then wait for a good opportunity to go long on a shorter term timeframe.

For instance, if a pair is trading upwards on the monthly, weekly and daily timeframe, you would be looking to enter on the 4-hour timeframe.

Shorter term traders could also wait for a pair to trade in the same direction on the daily, 4-hour and 1-hour chart, and enter trades in the same direction on the 15-minute chart.

To give you an idea of how you could execute this type of trading strategy, here is an example from the USD/JPY pair that occurred earlier today.

Identifying the Underlying Trend

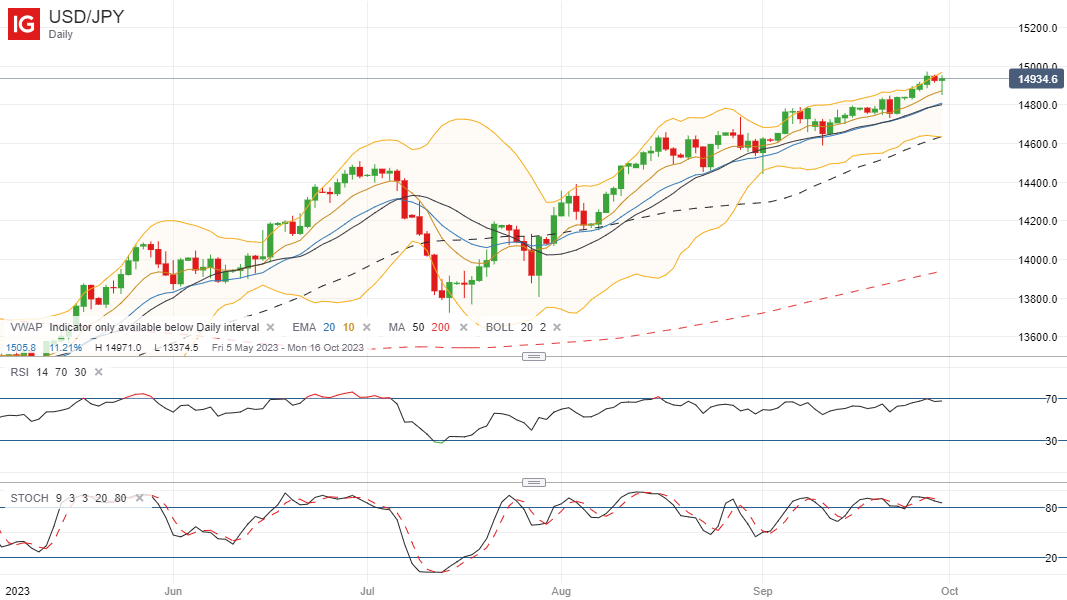
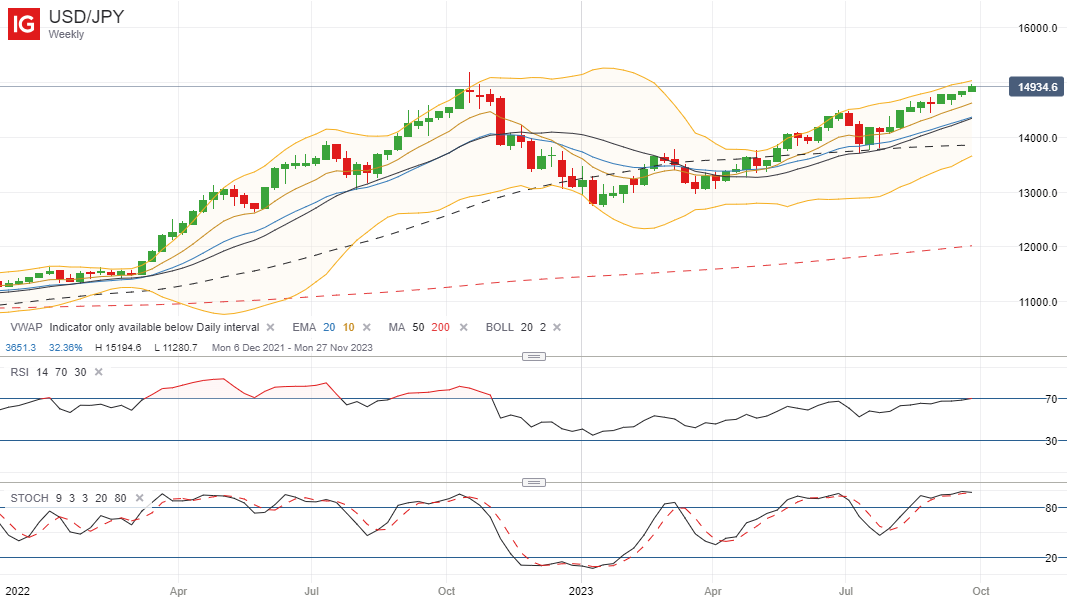
For this example I will be using my preferred EMAs (exponential moving averages), the 10, 20, 50 and 200-period EMAs, to indicate the trend.

More specifically, I want to find pairs where the price is trading above (or below for shorting opportunities) all four of these moving averages on at least two, but ideally three longer term timeframes, and that’s what we saw here.

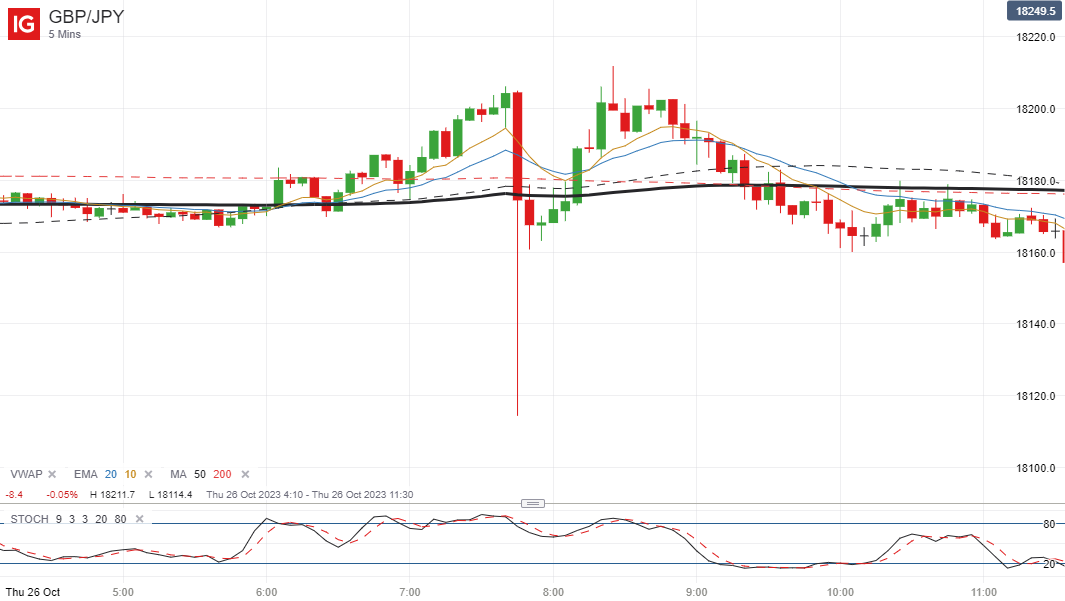
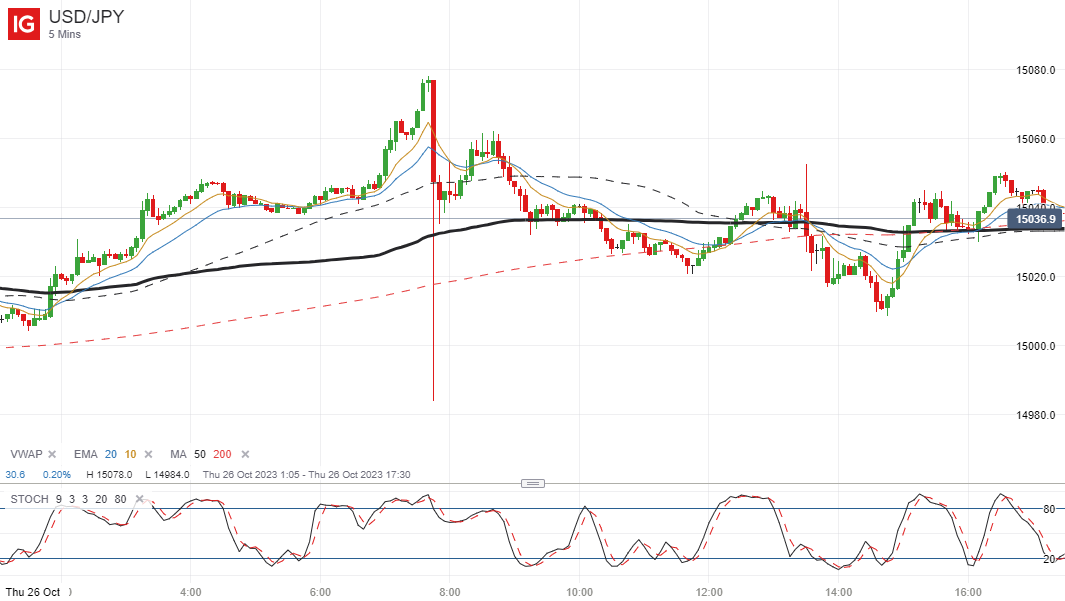
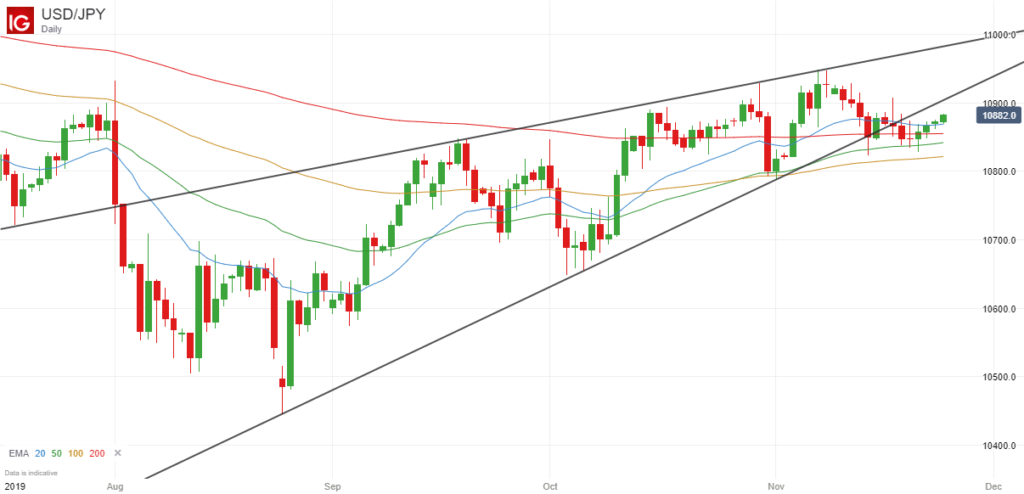
Here are the daily, 4-hour and 1-hour charts of the USD/JPY pair to highlight this:

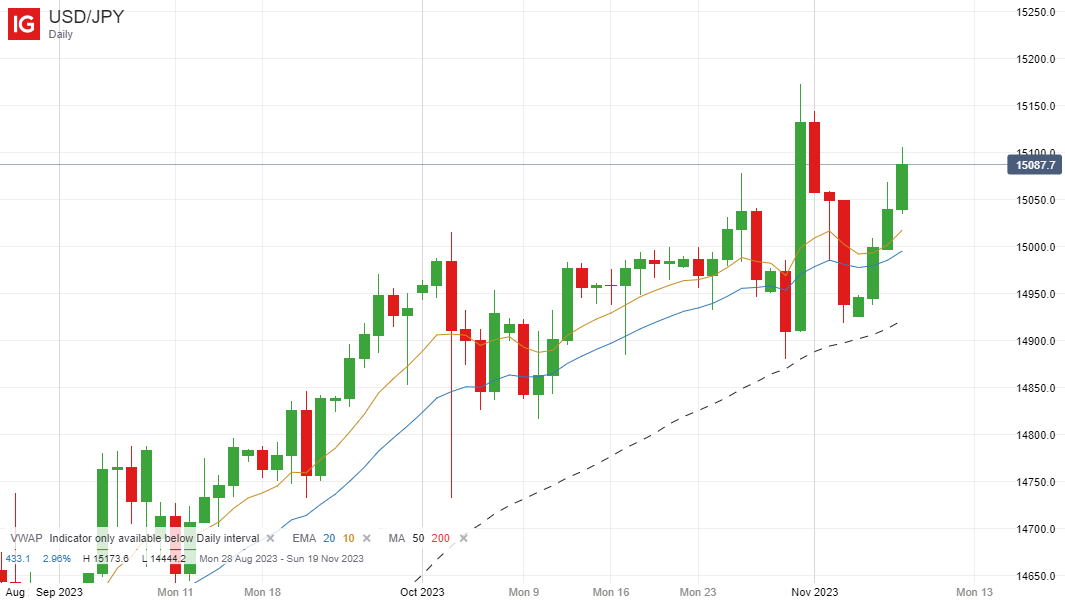
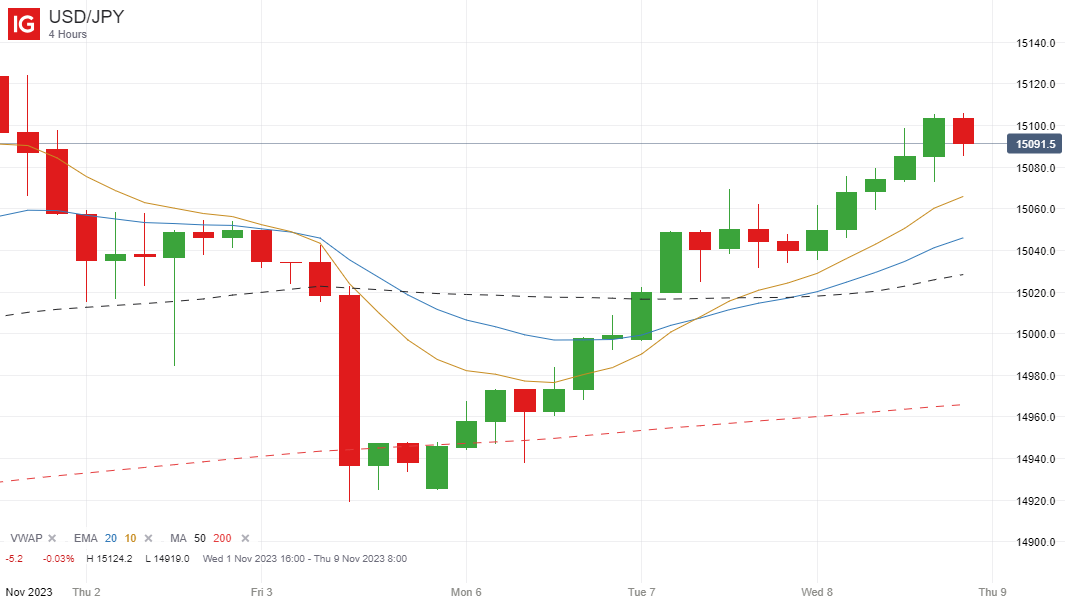
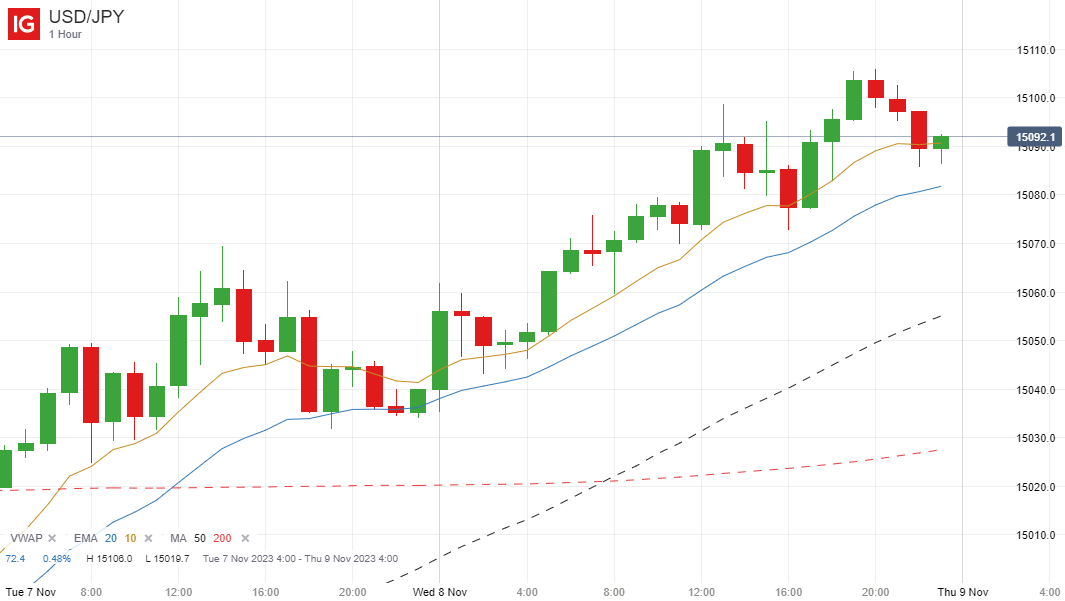
You can see that the price was above all four moving averages heading into the London market open at 8 AM.

Trade Execution

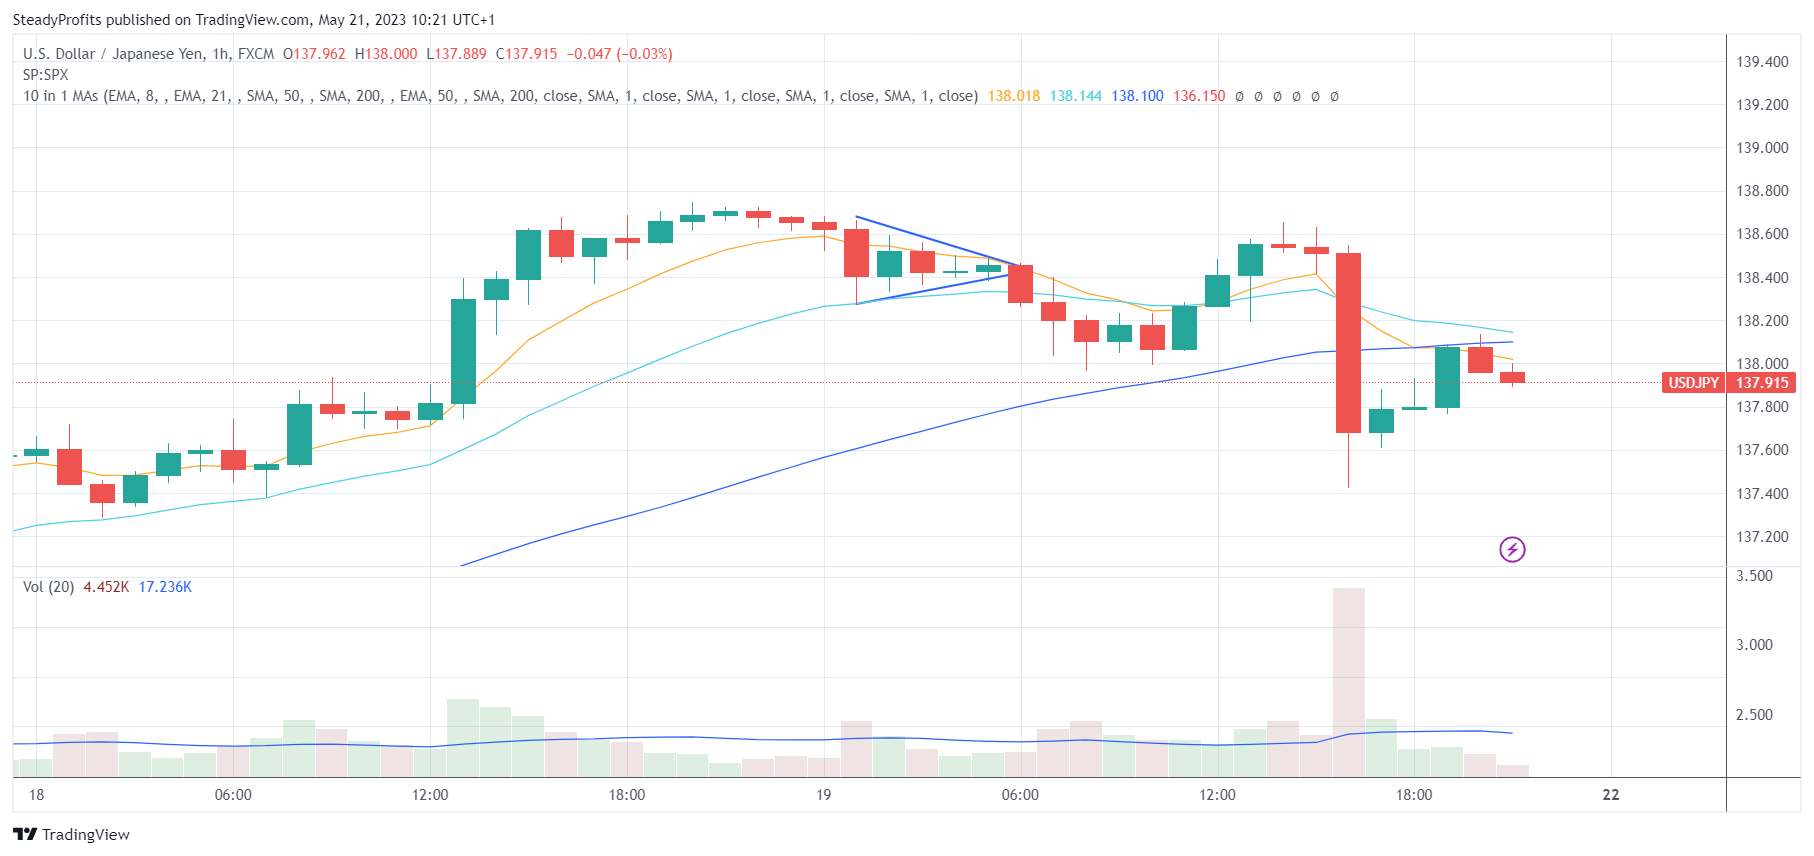
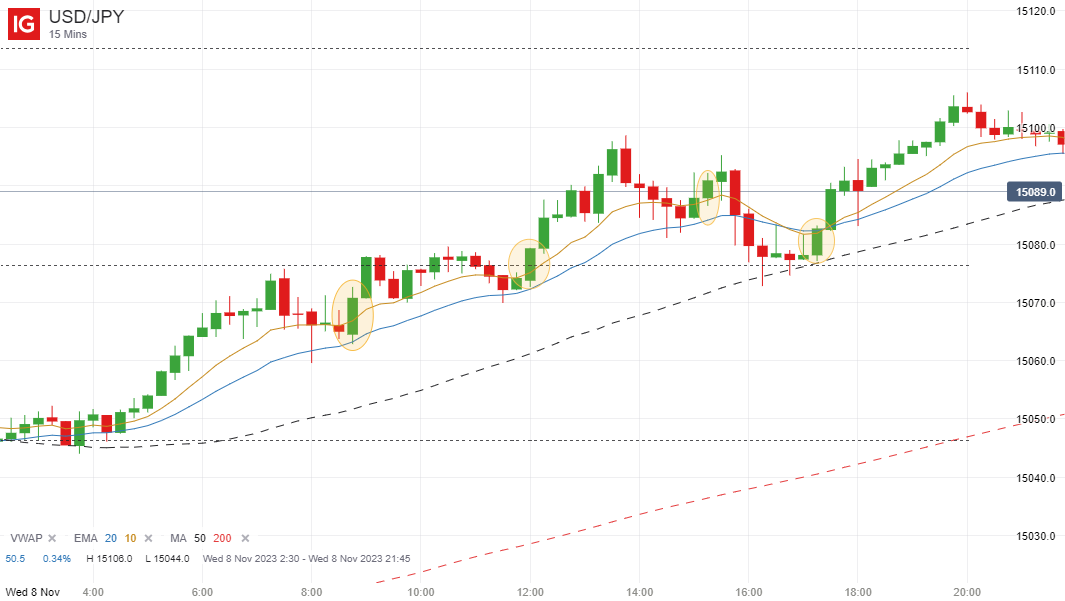
Once we established that this pair was in a very strong upward trend, the next step was to drop down to the next logical time frame, which in this example would be the 15-minute chart if we are continuing down from the 4-hour and 1-hour charts.

The key here is to wait for some temporary weakness on this timeframe followed by a continuation move in the same direction as the prevailing trend on the higher timeframes, ie upwards.

There are a few different ways you could trade this strategy. You could wait for a bounce off the 10 or 20-period EMA, or indeed the 50-period EMA, or you could wait for a bounce off the VWAP indicator.

You could also use a 5-period EMA instead of a 10-period EMA, and wait for the 5-period EMA to cross the 20-period EMA in the direction of the trend, which is another popular strategy.

It’s important to note that whichever strategy you use, you need to see the price move strongly higher after a period of weakness (preferably back above the EMA(5) or EMA(10)), and you should avoid entering early in anticipation of a possible bounce.

So with that in mind, I have circled four possible entry points on the 15-minute chart below where you could have entered a long position:

Final Thoughts

As you can see, 3 out of 4 of these trades would have been profitable and even the losing entry would have eventually moved into profit (if your stop loss wasn’t triggered first) thanks to the strength of the underlying long-term trend.

That’s the message I want to get across. Your entry points don’t always have to be perfect. If you always trade with the underlying trend, your overall win rate will be much higher, and by using a multi-timeframe strategy such as this one, it is not hard to find some high probability set-ups.

Filed Under: Analysis Tagged With: strategy, trend, trend trading, usdjpy

Beware of Spikes in GBP/JPY, EUR/JPY, USD/JPY, AUD/JPY Pairs

October 26, 2023 by James Woolley Leave a Comment

Crazy Spikes in Yen Pairs

If you trade the forex markets every day and follow some of the major yen pairs in particular, such as the GBP/JPY, EUR/JPY, USD/JPY and AUD/JPY, for example, you may have noticed that these have all had some huge spikes at various times in the last few weeks.

Of course it’s normal to see some big price spikes after major economic data releases, but with these yen pairs we have seen some huge movements on all of these pairs at the same time for no apparent reason.

The latest big price spike occurred early this morning at approximately 7.45 AM UK time, when there was no news scheduled on the economic calendar.

You can see on the 5-minute charts of the GBP/JPY, EUR/JPY and USD/JPY below how the price spiked sharply downwards before bouncing back upwards again almost immediately:

What is Causing These Price Spikes on the Yen?

The most likely explanation is that the Bank of Japan are intervening to try to strengthen the yen, particularly with the USD/JPY continuing to try to push above the key 1.50 level, although nobody knows for sure if this is true or not.

If it is, it doesn’t seem to be working because whenever there is a huge spike down, the price always bounces back straight away.

Why is This A Big Problem for Traders?

These spikes may not necessarily pose a risk for longer term traders who trade the daily, weekly or monthly timeframes, for example, but for those short-term traders who trade the lower timeframes, they can potentially destroy your account.

That’s because even if you use a relatively tight stop loss of 20 points, the price could easily gap down 80-100 points and your stop loss would be executed at this level instead.

Therefore you could incur huge losses on your personal account, and potentially lose a prop firm account if they have a low drawdown limit.

Indeed in recent weeks there have been quite a few traders on X (formerly Twitter) who have said that they lost their prop account because of one of these seemingly random spikes.

What is the Solution to this Problem?

If you want to protect your accounts, I think the most obvious solution is to simply stop trading the yen pairs altogether until the markets settle down and these sharp spikes stop happening.

There are plenty of other pairs that you can trade that don’t seem to have this problem, such as the GBP/USD, EUR/USD, EUR/GBP, AUD/USD, AUD/NZD, USD/CAD, USD/CHF etc.

At the present time, it is simply not worth the risk trading any of the yen pairs. Capital preservation is everything in this profession.

Filed Under: News Tagged With: gbpjpy, price spikes, usdjpy, yen

USD/JPY Hits New High and Had Another Strong Month in September 2023

October 1, 2023 by James Woolley Leave a Comment

Introduction

As we enter a new month, we can see that the USD/JPY recorded another strong month in September. The price closed the month out at 1.4934, just 66 points off the key round number of 1.5000.

Subsequently, this was the 5th month out of the last 6 that this pair finished higher, which just underlines how strong this particular forex pair has been.

At the start of this 6-month period, the USD/JPY was trading at around 1.33, so the dollar has strengthened against the yen by over 12% during this time.

Where Does the USD/JPY Go From Here?

Many swing traders will now be asking themselves where the USD/JPY goes from here?

Does it break through the 1.50 level and continue heading higher, or is it more likely to fall back down?

As always, nobody knows for sure. We can only make educated predictions based on fundamental and technical analysis.

On a technical basis, it is obvious that 1.50 is likely to act as a strong resistance level in the near term.

A new high of 1.4971 was achieved on Wednesday, and many traders will be looking to see how the price reacts if it gets close to 1.50 once again this week or later this month.

Oscillating Indicators Point to a Possible Pullback

With such a sustained price rise, it is natural to assume that the traditional oscillating indicators that indicate whether a particular currency pair is overbought or oversold will show that the USD/JPY is overbought, and that’s exactly right in this case.

As you can see from the daily chart below, the RSI is very close to the 70 line and the stochastics indicator is well over above the overbought level of 80, suggesting that the USD/JPY is potentially overbought up here.

The weekly chart is even more emphatic because the RSI has just crossed above the 70 level on this timeframe, and the stochastic indicator is also well above the 80 level here as well.

Of course these are no guarantees that the USD/JPY will reverse. In fact it is extremely dangerous to take big positions based on RSI and stochastics indicators being overbought or oversold.

However they do form part of the overall picture, and when you consider that the price is trading close to the upper Bollinger bands in both of these timeframes, the odds do slightly favour a near term reversal at least.

No Key Levels if the Price Breaks Above 1.50

One problem that you have when a pair is hitting new highs is that you have no previous levels to work from if the price is making a new all-time high, or have to use very old levels from months or years ago in many cases, as is the case here.

The USD/JPY last traded over the key 1.50 level back in October 2022 for a very short period, and didn’t actually close above it, so you can’t even draw a level of resistance from the closing price. All you have is the monthly high of 1.5194 to work with.

So if the oscillating indicators are wrong and the price continues to make new highs above 1.50, it is running into clear air on the chart and could have a strong move up to 1.53, 1.54 or 1.55 in the coming months as there are no sellers above from previous levels, and the dollar is fundamentally strong thanks to the potential of one or two additional interest rate rises.

Final Thoughts

The USD/JPY is clearing running into a key level of 1.50 right now, and I personally think that it’s a difficult one to call because although the price looks technically overbought on both the daily and weekly chart, the fundamentals of the dollar are strong with the Fed already hinting that there may be one more interest rate rises this year.

So this is definitely a case of wait and see. Any hint of selling / profit taking could take the price down to 1.465 fairly quickly, which is around the level of the 50-day moving average, and possibly even a test of the 200-day moving average nearer to 1.40.

However if 1.50 offers little resistance and there is little selling around this level, there is definitely the potential for the price to break through 1.50 and clear the previous October 2022 high of 1.5194 because this is a fairly weak resistance level.

Filed Under: News Tagged With: usdjpy

5 Hourly Inside Bar Candles on the USD/JPY – 19 May 2023

May 21, 2023 by James Woolley Leave a Comment

Introduction

I have always been a big fan of inside bar set-ups because these provide you with a low-risk, high probability entry point that can potentially have high rewards.

You can either trade them on the shorter time frames, such as the 5 or 10-minute charts, for example, to scalp a few points, or you can use them on the 1 hour, 4 hour or daily time frame to target even bigger moves.

The reason why they work so well is because you get a wide trading range with the initial candle followed by a series of smaller indecisive candles that all trade within the range of this first bar.

So when the price does eventually break above the high or below the low of the first bar/candle, the move can be quick and decisive as it will often quickly gather momentum and continue moving in the direction of the breakout.

USD/JPY Set-Up

I wasn’t at my computer during the Asian and pre-London trading session on Friday (19 May 2023), but as I was reviewing my charts this weekend, I noticed what would have been a really great set-up on the 1 hour chart of the USD/JPY pair.

There was a large red candle at 1.00 AM UK time right at the start of the Asian trading session on the USD/JPY pair, followed by four very small candles that all traded within the range of this initial candle between 2 AM and 6 AM, as you can see below:

Trading Opportunity

With a narrow triangle forming on this inside bar set-up, it was only a matter of time before the price broke upwards or downwards out of this tight range, and when it did occur the hourly breakout candle closed at 7 AM, just when volume starts to pick up before the London market opens.

Therefore it was always likely to continue moving, and in this case if you had taken a short position at the close of the breakout candle at 138.28, you could have ridden it down to the 138.00 whole number or closed a partial for 28 pips profit, where it ended up finding support.

You could also have zoomed into the 1 or 5-minute chart to get an earlier entry point during the 1-hour breakout candle once it looked likely that this breakout was likely to continue.

Final Thoughts

Of course it’s easy to talk about these profitable set-ups after they have occurred, but the point is that these inside bar formations occur all the time, and when you a get a long extended set-up of 5 hourly candles in this case, the odds of success are extremely high when the breakout does eventually happen.

Therefore you always want to be scanning the charts of various pairs (on various time frames) to try to visually spot them when they are setting up because they can be very profitable to trade.

Filed Under: Analysis Tagged With: breakout, inside bar, usdjpy

USD/JPY Analysis November 2019 – Downward Breakout Possible

November 25, 2019 by James Woolley Leave a Comment

Price Action

It has been interesting to watch the price action of the USD/JPY pair in recent months because after hitting a low of around 104.46 back in August, it has been slowly trending upwards since then, and currently trades at 108.80 at the time of writing.

Indeed as you can see from the price chart below, the price has bounced back so much, it has not only touched the 200-day exponential moving average (as indicated by the red line), but has also traded above it for quite a while.

USDJPY Daily Chart - November 2019

Downward Price Breakout

You can also see from the chart above that it was clearly trending within two trendlines that marked the high and low points of this rising trend, but significantly closed below the lower trendline last week.

To be honest, I was expecting that this would probably mark the end of the recent uptrend, and would be the catalyst for a new downward move for the USD/JPY, but so far there hasn’t been a wave of selling to drive the price lower.

This is probably because some analysts, including Goldman Sachs, have been talking down the prospects of a recession in the US and global economy in 2020, predicting growth rates of 2.3% and 3.4% respectively for the coming year.

Nevertheless, there is still a possibility of a strong bearish candle forming on the daily chart in the next few days, so it could still be worth watching.

Future Price Moves

If the price does trade strongly lower, and closes below its two recent lows of 108.24 and 108.28, then I would be fairly confident that this would signal the start of a new downward price breakout.

As a result of this, the price would close below all of its major moving averages (20, 50, 100 and 200-day EMAs) and there is a lot of downside potential because it could easily drop back into the 104 – 106 range.

The alternative scenario is that the recent short-term strength in the USD/JPY continues, and we continue to see the price trading upwards of 109.

If this were to happen, then we would see the 50 and 100-day EMAs cross over the EMA (200), which is a very bullish signal that could attract a wave of buying to push the price above its previous highs of 109.50 and beyond the 110 level.

So the point is that while the picture is still unclear, the price action of the USD/JPY over the coming days and weeks could give you a strong indication as to whether there is going to be a sustained upwards or downwards trend in the near future.

I would probably favour a downward breakout at this moment in time simply because the MACD and stochastic indicators are suggesting that this long-term upward trend is running out of momentum on the weekly chart, but as I say, there is no need to second-guess the direction of any breakout until we get some clearer signals on the daily chart.

Filed Under: Analysis Tagged With: breakout, usdjpy

  • 1
  • 2
  • Next Page »

Forex Rebates:

Choose from 40+ different forex brokers and crypto exchanges, and get cashback every time you trade:


Copy Profitable Traders:

If you join ZuluTrade, you can follow and subscribe to profitable traders and all of their trades will be automatically copied in your own trading account.

You can also earn money as a signal provider if you are already a profitable trader.

Click here to find out more

Recommended Broker:

Recent Blog Posts:

  • High Probability Trade on S&P 500 – 26 January 2024
  • Oanda Moves Into Prop Trading With Labs Trader Program
  • My eToro Performance in 2023 – Up 33.24%
  • The5ers Offering $20K Bootcamp Challenge For Just $1
  • Example of VWAP Bounce Trade on S&P 500 – 18 December 2023

Recent Articles:

VWAP Indicator
  • MA Sabres (LuxAlgo) Indicator
  • 10 Harsh Truths About Forex Trading
  • Best Websites for Monitoring Currency Strengths
  • Xmaster Formula Indicator for MT4 and MT5
  • Tools:

    Currency Heat Map

    Categories

    • Analysis
    • News

    Archives

    • January 2024
    • December 2023
    • November 2023
    • October 2023
    • September 2023
    • August 2023
    • July 2023
    • June 2023
    • May 2023
    • August 2020
    • June 2020
    • May 2020
    • April 2020
    • January 2020
    • December 2019
    • November 2019
    • October 2019
    • September 2019
    • August 2019
    • July 2019
    • June 2019
    • May 2019
    • April 2019
    • March 2019
    • February 2019
    • January 2019
    • December 2018
    • November 2018
    • October 2018
    • September 2018
    • August 2018
    • July 2018
    • June 2018
    • May 2018
    • March 2016
    • December 2015
    • November 2015
    • October 2015
    • August 2015
    • July 2015

    Disclaimer

    This website should be used for general information purposes only and in no way represents professional financial advice.

    Forex and CFD trading carries a high level of risk and it is possible to lose more than your initial deposit if using leveraged products.

    Copyright © 2025 · eleven40 Pro Theme on Genesis Framework · WordPress · Log in

    • About
    • Contact
    • Disclosure
    • Privacy Policy
    • Terms Of Service