The Forex Chronicles

  • Rebates
  • Brokers
  • News
  • Analysis
  • Signals
    • Best Copy / Social Trading Platforms
    • eToro Review
    • FXTM Invest Review
    • Marketclub Review
    • ZuluTrade Review
  • Indicators
  • Strategies
  • Articles

High Probability Trade on S&P 500 – 26 January 2024

January 27, 2024 by James Woolley Leave a Comment

Introduction

Many traders are sceptical about whether or not you can find high probability set-ups on the lower timeframes because the price can move around so fast, and seemingly at random a lot of the time.

However I believe that it is still possible to find good quality trades on these lower timeframes because I regularly take these trades myself on the 5-minute chart of the major stock market indices, and tend to have a decent hit rate.

Some of the very best traders just use price action alone to find high probability trades, such as Al Brooks, for example, but I like to have a few additional indicators on the chart for guidance.

These include the VWAP indicator, the stochastic indicator and several moving averages, and just yesterday (26 January 2024) they all combined to provide a high probability set-up on the S&P 500, as I will demonstrate in the rest of this article.

The Set-Up

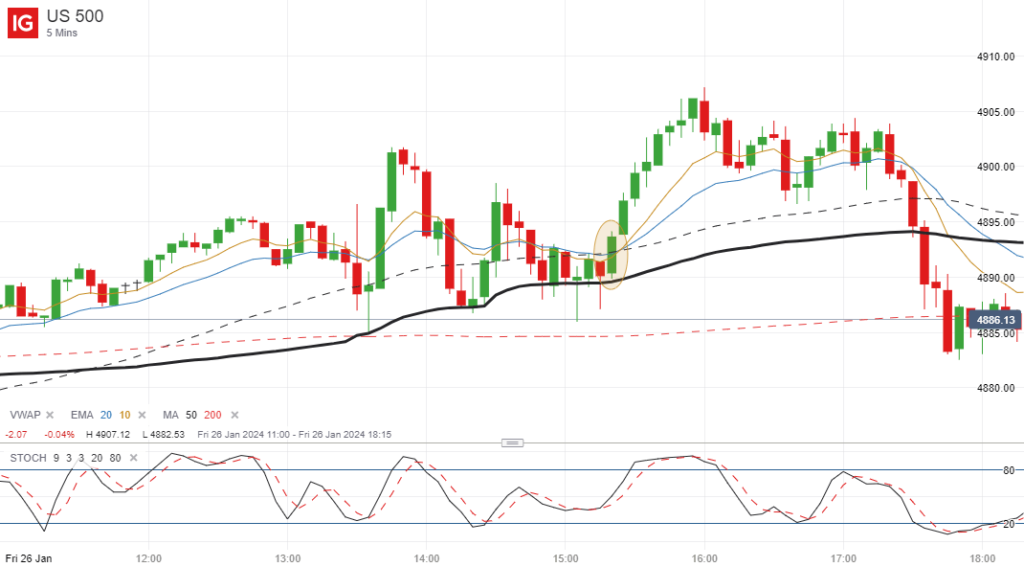
As you can see in the 5-minute chart below, the price of the S&P 500 opened slightly higher when the market opened at 14.30 (UK time) before dropping back towards the VWAP indicator (shown in black), where we saw a lot of sideways price action and indecision around this key indicator.

Crucially, the price failed to close below the VWAP and was also trading close to the 10, 20 and 50-period exponential moving averages, so this was all pointing to a possible breakout.
Trade Execution

I was already going into the trading session with a bias to the long side because the trend was so bullish on the higher timeframes.

So when the price bounced off the VWAP, and closed above these three moving averages with one very strong 5-minute candle, I was ready to enter a long trade if the price broke the high of this candle, which it duly did.

The fact that the price closed above the highs of the previous 6 candles and was showing significant divergence on the stochastic indicator at the bottom of the chart just gave me added confidence that this was going to be a strong breakout.

I ended up entering a long position on this initial breakout at 4894.4 and closed half the position at 4900 because this was a major round number that could have acted as strong resistance, and the other half at 4905 after the price had continued pushing higher without any red candles.

As a result, I banked a total profit of just over 8 points from the two positions combined.

Closing Comments

You can see from the chart above that the price of the S&P 500 subsequently dropped back later in the session, but that was irrelevant.

The point is that at that particular time, the indicators and price action were all pointing to a breakout to the long side, and when I see a confluence of indicators like this and a tightness of price action prior to the breakout, this is a time when I like to take a position.

It is rare to see the price of this particular market trading in a narrow sideways range around key indicators at the start of a session, but when you do, you know that in most cases there will eventually be a breakout and a strong surge in one direction or the other, even if it doesn’t last for the whole day.

So it is always worth keeping an eye out for these high probability set-ups because they do come up on a regular basis, even on the 5-minute chart, which is my preferred shorter term timeframe.

They won’t always be profitable of course, but by using tight stop losses, there should be more winning trades than losing trades, and the profits from these trades should exceed any losses that you may incur.
Filed Under: Analysis Tagged With: divergence, s&p500, vwap

Example of VWAP Bounce Trade on S&P 500 – 18 December 2023

December 19, 2023 by James Woolley Leave a Comment

Introduction

I just uploaded a new article to this site a few days ago that took a closer look at the VWAP indicator, and how it can benefit stock, indices and forex traders, particularly those who like to day trade these markets on the lower timeframes.

In this article I pointed out that one of the best set-ups is when you get an initial move higher followed by a retracement back down to the VWAP indicator because this is where you will often see a strong level of support, and in many cases a nice bounce higher.

Well as it turned out, we got a textbook VWAP bounce on the S&P 500 only yesterday and it is this trade example that I want to walk you through today.

S&P 500 Trade Set-Up

As you are probably aware, the markets have been really strong in December and getting close to new all-time highs.

Subsequently, if you would have looked at the longer timeframes on the S&P 500 at the opening bell yesterday, you would have seen that the price was above the 10 and 20 exponential moving averages on the monthly timeframe all the way down to the 4-hour timeframe, and had just popped above them on the 1-hour chart as well.

Therefore the trend was ultra-bullish, and you should only really have been looking for opportunities to go long because you would really have been swimming against the tide if you had attempted to short this market.

One way of doing this is waiting for a retracement and then taking a long position when the price moves upwards through these moving averages on a lower timeframe, but VWAP bounces can be just as effective when they occur.

Obviously if you get a VWAP bounce and a move through the moving averages, that’s even better!

Trade Execution

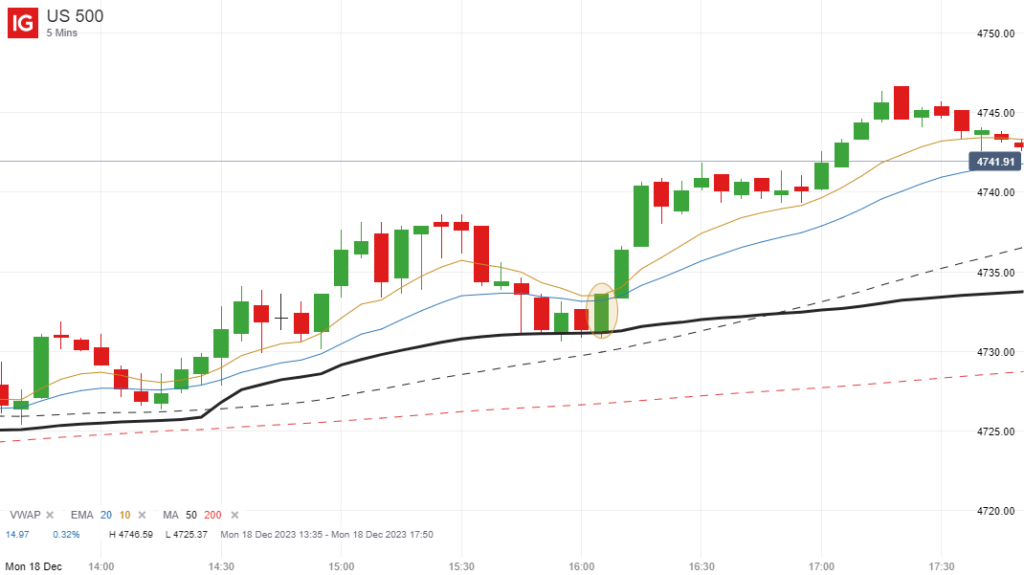
In the case of yesterday’s price action on the S&P 500, we did see an initial move higher, but short-term traders will have noticed that the price started to retrace back towards the VWAP on the 5-minute chart after the first hour of trading.

As I mentioned earlier, with the underlying trend being so strong, this is the area where traders should consider going long if buyers started to step in, and the close of the highlighted candle was a good time to do so.

This is where we saw the first strong bounce off the VWAP, and we also saw the price break through the prior highs from the previous two candles as well. Plus it also closed at the high of the candle, which was another sign of strength.

You will also see that the price just about closed above both the 10 and 20-period exponential moving averages as well, so this was a really high probability set-up.

Your losses could be easily capped by placing a stop loss just underneath the most recent low, or somewhere just below the VWAP indicator, and your potential gains to the upside are essentially unlimited.

Closing Comments

It’s always important to point out that these and other similar set-ups are not completely foolproof.

There will be times when the price will look like it is bouncing back off the VWAP indicator, but then burst straight through it and continue moving lower, but if you manage your losses, this isn’t a problem and is just part of trading.

The key to successful trading is to find opportunities to put the odds of success in your favor, and trading VWAP bounces is one way of doing this if you wait for the right set-ups.

Filed Under: Analysis Tagged With: s&p500, vwap

S&P500 Shorting Opportunity at VWAP and Fib Levels – 20 October 2023

October 21, 2023 by James Woolley Leave a Comment

Introduction

As I am based in the UK, I don’t generally like to trade on Friday afternoons when the US markets open. I prefer to close out any positions before then and finish early for the week.

That’s because Friday’s price action can be difficult to predict, and if a trade does move against you, it is a horrible feeling to take a loss at the end of the week heading into the weekend.

The alternative is to hold a position over the weekend, but it can be very expensive because of the additional fees, and you run the risk of the market gapping up or down when it opens the following week, incurring even greater losses.

So I didn’t trade the S&P 500 at all yesterday, and didn’t even look at it until it closed, but I did notice a very high probability short set-up that I missed, and thought that it was worth discussing it in more detail.

Bearish Sentiment

With everything that is happening in the middle East right now, I think most traders would naturally be nervous about holding any long positions over the weekend, and may well have been looking for opportunities to short the S&P 500, expecting a sell-off heading into the close.

As it turns out, this is exactly what happened, and looking at the price action, there was an excellent opportunity to go short right in the middle of the session, prior to this.

VWAP and Fibonacci Confluence

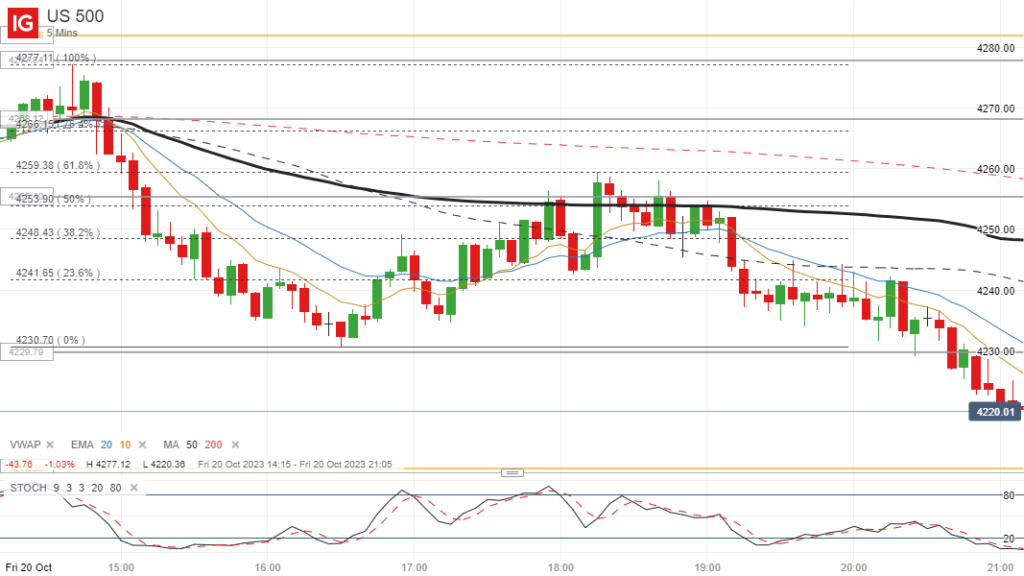
The S&P500 was relatively strong at the open, hitting a high of around 4277, before the sellers and shorters came in, driving the price all the way down to a low of around 4230.

Some traders will have attempted to short the opening rally, expecting a sell-off, and some momentum traders will have jumped on board during this downward move, but traders who were late to the party still had a good chance to short the subsequent pull-back rally.

By applying the fibonacci tool to the high and the low of this downward move, you could have easily identified potential reversal points at the key 50% and 61.8% fib levels, and if you use the VWAP, like so many other traders, you will see that this indicator was sitting very close to these key levels as well, creating another strong resistance level that the price has to get through.

Subsequent Price Action

As you can see from the 5-minute chart of the S&P500, the 50% fib level and the VWAP (shown as a thick black line) were at exactly the same level initially, and the price immediately sold off at this area of confluence, as you might expect, giving a maximum profit of around 12 points.

The price then bounced back and briefly broke through the VWAP, attempting to test the important 61.8% level, but after making two attempts, this also acted as a strong resistance level and the price ended up making a decisive move below the VWAP back to the lows of the day.

Final Thoughts

The main point that I want to get across in this article is that when you have the VWAP and some key fibonacci levels at the same price levels, particularly after a big price move beforehand, this can present you with a high probability trading opportunity.

Traders will always be looking to trade VWAP reversals anyway, and if you have a strong 50% or 61.8% level close by (or both), this will only add to their conviction.

In this case you also had very bearish sentiment and nervousness about the markets generally due to geopolitical tensions, so all of these factors combined to give traders a very nice short set-up.

I know many traders don’t like to use fib levels, but this is one more tool that you can use to tilt the odds in your favour, so it should never be disgarded completely.

If you missed this particular trade, like myself, don’t worry because there will be always be many more like this in the future. You just need to keep your eye out for them.

Filed Under: Analysis Tagged With: fibonacci, s&p500, vwap

Forex Rebates:

Choose from 40+ different forex brokers and crypto exchanges, and get cashback every time you trade:


Copy Profitable Traders:

If you join ZuluTrade, you can follow and subscribe to profitable traders and all of their trades will be automatically copied in your own trading account.

You can also earn money as a signal provider if you are already a profitable trader.

Click here to find out more

Recommended Broker:

Recent Blog Posts:

  • High Probability Trade on S&P 500 – 26 January 2024
  • Oanda Moves Into Prop Trading With Labs Trader Program
  • My eToro Performance in 2023 – Up 33.24%
  • The5ers Offering $20K Bootcamp Challenge For Just $1
  • Example of VWAP Bounce Trade on S&P 500 – 18 December 2023

Recent Articles:

VWAP Indicator
  • MA Sabres (LuxAlgo) Indicator
  • 10 Harsh Truths About Forex Trading
  • Best Websites for Monitoring Currency Strengths
  • Xmaster Formula Indicator for MT4 and MT5
  • Tools:

    Currency Heat Map

    Categories

    • Analysis
    • News

    Archives

    • January 2024
    • December 2023
    • November 2023
    • October 2023
    • September 2023
    • August 2023
    • July 2023
    • June 2023
    • May 2023
    • August 2020
    • June 2020
    • May 2020
    • April 2020
    • January 2020
    • December 2019
    • November 2019
    • October 2019
    • September 2019
    • August 2019
    • July 2019
    • June 2019
    • May 2019
    • April 2019
    • March 2019
    • February 2019
    • January 2019
    • December 2018
    • November 2018
    • October 2018
    • September 2018
    • August 2018
    • July 2018
    • June 2018
    • May 2018
    • March 2016
    • December 2015
    • November 2015
    • October 2015
    • August 2015
    • July 2015

    Disclaimer

    This website should be used for general information purposes only and in no way represents professional financial advice.

    Forex and CFD trading carries a high level of risk and it is possible to lose more than your initial deposit if using leveraged products.

    Copyright © 2025 · eleven40 Pro Theme on Genesis Framework · WordPress · Log in

    • About
    • Contact
    • Disclosure
    • Privacy Policy
    • Terms Of Service