It can be quite exciting when you first start developing an interest in forex trading because once you start looking at various different price charts, you will find that there are many different technical indicators that you can use.
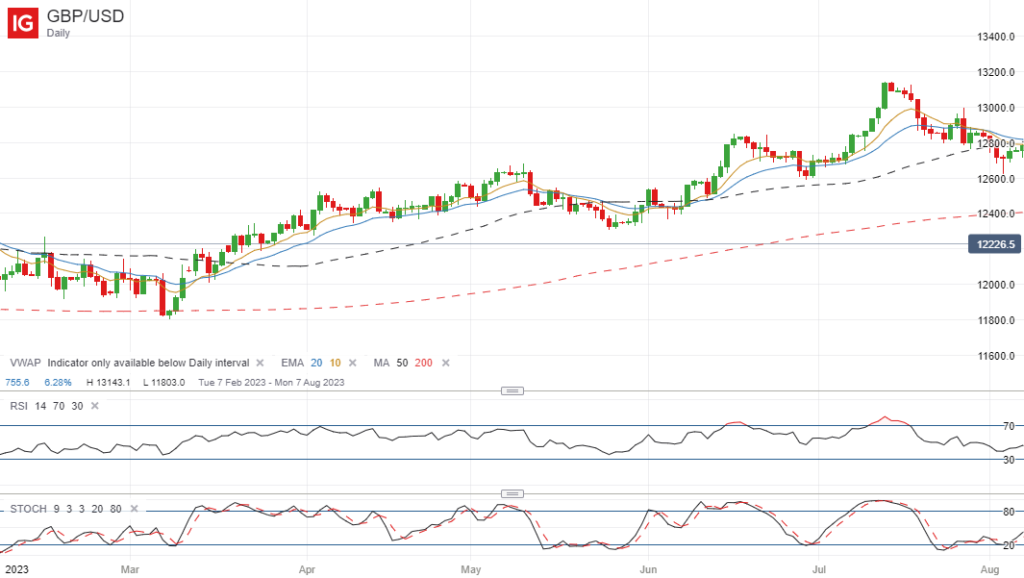
There are the ones that many traders like to use, such as RSI, stochastics, moving averages, etc, all of which can be used on the same chart, as shown below, as well as lots more that you might not have heard of before.
Subsequently it can be quite fun learning about each one and playing around with them because by combining a few of these indicators together, you can often come up with a workable trading strategy that is able to find lots of high probability trading opportunities.
So to help you understand how these indicators work and what kind of information they are conveying, here is a guide to the four different types of indicators that are available:
Trend Indicators
It is often quite easy to determine the price trend of a given pair just by looking at the price chart, but there are lots of indicators that are designed to indicate the current trend.
The simple and exponential moving averages are the ones that many traders use, but you can also use other indicators such as the Supertrend, MACD and Parabolic SAR indicators, for example.
You don’t need to stick to the same old indicators that are found on every trading platform either. There are some very talented traders who have coded their own technical indicators that will get them into a new trend relatively early, and alert them to any major trend changes.
You will find quite a few custom indicators on TradingView that people have built, but Metatrader has this Xmaster Formula indicator and many others that have been downloaded thousands of times, and appear to be every bit as effective, if not more so.
These trend indicators are useful because they will help you trade in the same direction as the underlying trend, which is always the most profitable strategy. Plus they will also signal a change in trend, which will enable you to enter a position right at the start of a new trend.
Momentum Indicators
The price of a particular currency pair will often trend upwards or downwards for long periods of time, but it’s often useful to know the strength of a particular trend, which is why momentum indicators are very helpful.
Examples of these indicators include RSI, stochastics and CCI, and you will find that they oscillate from overbought to oversold as the price rises and falls.
Although they are not 100% reliable, they generally indicate that the trend is starting to run out of momentum and may be about to reverse once it enters overbought or oversold territory.
If you wait until you see a divergence pattern on these oscillating indicators, it will often give you an even clearer signal of a potential reversal because if the price is making new highs but the indicator in question is making lower highs, for example, it is clearly running out of momentum.
Volume Indicators
Volume indicators are most commonly used by stock traders because it can be hard to find volume data for individual currency pairs, and the volume indicators that are available may only be based on an individual broker’s volume rather than the whole market.
There are other volume-based indicators that you can use, such as the Chaikin Money Flow and On Balance Volume indicators, but these aren’t generally shown when looking at forex pairs because the volume data isn’t available.
So if you do want to look at the volume for a particular currency pair in order to give you an edge, you need to do some research and find a broker or a charting platform that accurately reflects the traded volume, and therefore has indicators based on this data.
Volatility Indicators
There will be times when the price of a particular pair is extremely volatile and whipsawing upwards and downwards, and there will be quieter times when the price is barely moving at all and is stuck in a narrow trading range.
Sometimes this is obvious, but it is always useful to use one of the volatility indicators that are available because these will give you a good indication of the volatility at any given moment.
The ADX and Average True Range indicators are two of the best ones that you can use for this purpose, but there are some less well-known ones that can be quite useful as well, such as this STARC bands volatility indicator, which displays upper and lower bands that widen during volatile periods and contract during quieter periods.
This indicator will also show when a market is extremely overbought or oversold when the price moves outside of these bands, so it has many benefits.
Which Ones To Use?
Every trader will have their favourite set of indicators, but if you want to get a really good snapshot of the market and want to find lots of high probability set-ups, it is generally a good idea to use at least one indicator from each category.
Admittedly it is very difficult to find a volume-based indicator when trading forex, but you should definitely consider having at least one trend, momentum and volatility indicator displayed on your charts because this will make it much easier to come up with a winning strategy.

Leave a Reply