Introduction
There are some traders who like to look at one single time frame when trading the forex markets, whether it’s the 5-minute, 15-minute, 1-hour, 4-hour or daily chart, for example, and if they are making consistent profits, then there is absolutely nothing wrong with this approach.
However many traders would agree that it is a lot easier to make money by looking at the price action on two or more time frames in order to get a good idea of the prevailing long-term trend. That’s because it is easier to trade with the trend rather than against it.
It is possible to do this by simply switching between charts manually, or by using multiple monitors, but many of the leading charting platforms now have a feature where you can see multiple time frames on a single screen.
For example, if you use IG’s charting platform, they have an option to view 1, 2, 3 or 4 charts on a single screen for any market.
Here is what the 4-chart option looks like:
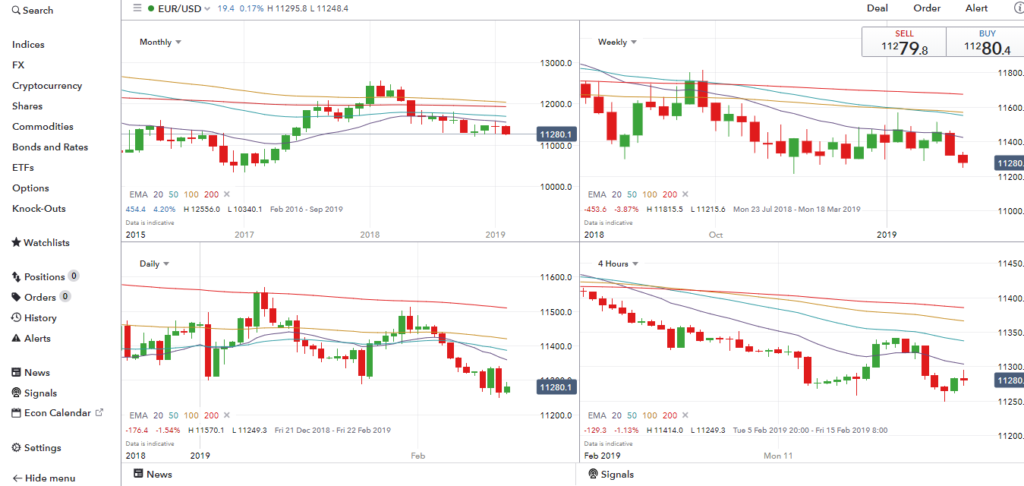
As you can see, this shows the price movements of the EUR/USD on the monthly, weekly, daily and 4-hour chart.
So why is this useful? Well here are some of the main benefits:
Monitor Trends on Multiple Time Frames
As mentioned above, one of the main benefits is that you can instantly view the trend on multiple time frames in order to increase your chances of success.
If you draw a series of moving averages on each chart, for example, it is very easy to see if the price is trending upwards or downwards because it will generally be in an upward trend if it is above these moving averages, and vice versa if it is trading below these moving averages.
Ideally, you want to see the same trend on each of the three longer time frames, and then look for opportunities to trade into this trend on the shortest time frame.
So if there is a strong downward trend on the daily, 4-hour and 1-hour chart, then it might be profitable to wait for some strength on the 15-minute chart and enter a short position if it turns downwards again.
Alternatively, you might prefer to just look at the trend on the monthly and weekly chart, and look for opportunities to trade with this longer-term trend on the daily chart, in which case you would only need to view 3 price charts on a single screen.
Avoid Trading Range-Bound Markets
It can sometimes feel that the markets are moving quite a lot when you are trading the shorter time frames, but by viewing the price action on multiple time frames, you can instantly get an idea of how volatile the markets actually are right now.
If a currency pair is struggling to move in a clear direction on multiple time frames, then you should really avoid trading until conditions are more favorable.
Find Trading Opportunities a Lot Quicker
The final benefit of using multiple charts on a single screen is that this makes it a lot quicker to find potential trading opportunities.
The more you trade, the more you will recognise high probability set-ups, and if you are viewing four charts for each pair, you can quickly scan through each of the major pairs to see potential set-ups for each day.

Leave a Reply