Introduction
If you like to day trade the forex markets, you don’t really want to be trading slow-moving pairs such as the EUR/GBP pair, for example.
Instead you want to be trading those pairs that are trending strongly in one direction and/or displaying high levels of volatility because these are moving a lot right now, and are likely to give you enough movement to generate some decent profits.
One way you can do this is to look at currency strength meters or heatmaps because these will show you which pairs are currently in the strongest trends across multiple different time frames (1-minute, 15-minute, 1-hour, 4-hour, daily, etc.).
So in this article I want to recommend two of the best websites that will provide you with this data in real time.
Investing.com Currencies Heat Map
Investing.com has a wealth of data relating to stocks, indices, currencies and cryptocurrencies, but the currency heat map is the tool that I have always found to be the most useful.
On this page you will find the strength of the eight major currencies paired against each other (USD, EUR, JPY, GBP, CHF, CAD, AUD, NZD), displayed across four different time frames (30-minute, 1-hour, 5-hour and daily).
The strength of the trend will be indicated by the color, so it is very easy to interpret this data.
A very strong bullish trend will be indicated by a dark green bar, a moderately bullish trend by a light green bar, a bearish trend by a light red bar and a strong bearish trend by a dark red bar.
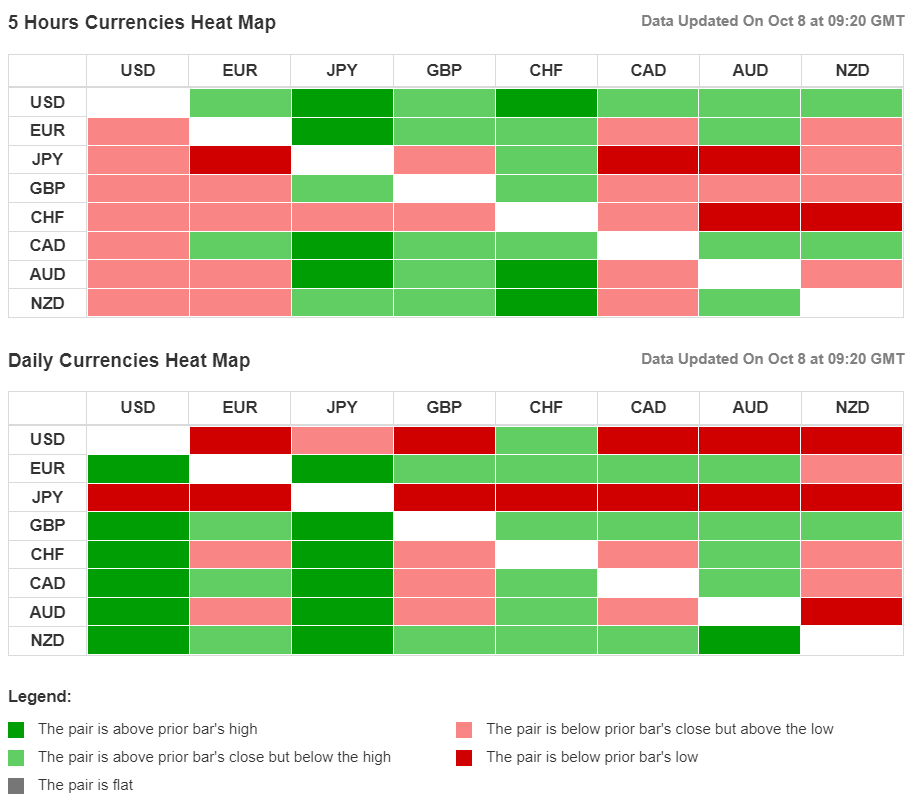
Therefore when you look at any time frame, you will instantly see the pairs that are trending the most because they will either be dark green or dark red, and if you want to drill down even further, you can look at multiple time frames for possible trade ideas.
For example, if you see that the GBP/JPY is in a very strong bullish trend on the daily and 5 hour time frame, but is red on the on the 30 minute or 1 hour time frame, this could be setting up a good trading opportunity for a continuation trade in the direction of the prevailing longer term trend.
Similarly, if the heatmap indicated that a pair is in a very strong bullish or bearish trend on all four time frames, it could be a profitable strategy to look for a good entry in the same direction on the 1 or 5-minute chart, for instance, possibly after a brief pull-back.
→ Click here to visit the currency strength page at Investing.com
Finviz.com Forex Performance Screener
Another very useful website that I like to use is Finviz. You may already be familiar with Finviz.com because they have a very powerful stock screener, but their forex performance page is also an invaluable tool if you like to trade forex.
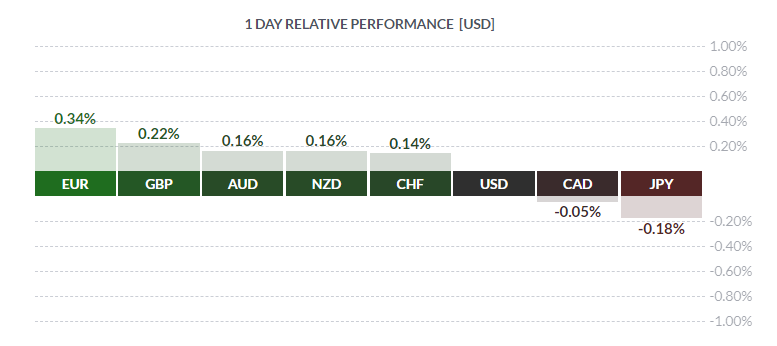
That’s because they have a 1-day relative performance chart that shows which currencies are currently the strongest and weakest against the US dollar over a 1-day period, as well as higher timeframe performance charts for longer term traders.
Therefore you can instantly see which dollar pairs are in-play and potentially worth trading, whether you wish to trade a trend continuation pattern or whether you prefer to trade reversals when strong trends start to run out of momentum.
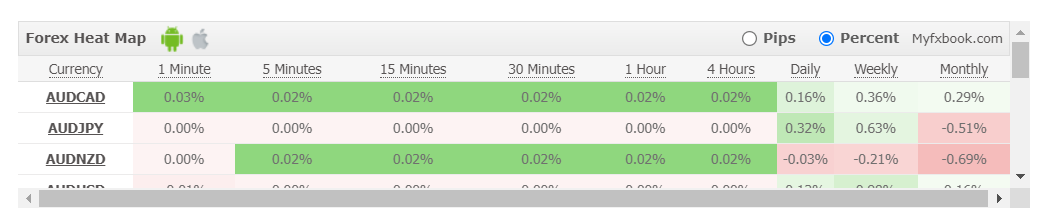
In addition to this relative performance chart, Finviz also has a table that displays the performance data of nine of the most actively traded currency pairs across multiple timeframes, from 5 minutes right the way up to quarterly, half-yearly and yearly.
So if you click on the timeframe headings, you can sort the data and see which pairs are moving the most in each timeframe.
→ Click here to visit the forex performance page at Finviz.com
TheForexChronicles.com Heatmap
Investing.com and Finviz are two of the top websites if you are looking to gauge currency strength and find the strongest trending pairs across multiple timeframes, but I would just like to mention that I have recently added a heatmap to this website that you may also find useful.
This heatmap also provides real-time data of the strongest trending pairs, but I have customized it to include several more forex pairs that I like to trade.
→ Click here to check out this live forex heat map
Final Thoughts
If you have a small group of currency pairs that you like to monitor every day, then you may prefer to scan through the charts of each one to see which pairs are moving when you switch your computer on each morning.
However if you prefer to monitor a wider group of pairs in order to find the very best set-ups, you should seriously consider using one of the currency strength meters / heatmaps featured above because they will save you a lot of time.

Leave a Reply