What Does EMA Mean / Stand For In Forex And Stock Trading?
Anyone who has ever used price charts to trade stocks and forex pairs will probably have come across moving averages at some point because these are some of the most popular technical indicators that are available, and have many different uses.
However while many people may know about SMAs and EMAs, for example, they may not necessarily know what they actually mean, and which one they should be using, so let me address the first point straight away:
EMA stands for Exponential Moving Average
(SMA stands for Simple Moving Average)
Simple Moving Average
If you plot a simple moving average (SMA) on your price chart, it will show the average of the most recent closing prices of the period of your choice.
So on a daily chart, for example, a 20-period SMA will indicate the average price based on the previous 20 days, and is therefore a good indicator of the short-term trend, while a 200-day simple moving average will show the average price of the previous 200 days, and is obviously a much clearer indicator of the long-term trend.
You can instantly see if a stock or forex pair is trending upwards or downwards over time, and if the short-term and long-term moving averages are moving upwards or downwards at the same time, you know if you have a really strong trend in place.
Exponential Moving Average
The exponential moving average (EMA) is similar to the simple moving average, except that it places more weight on the most recent prices. Therefore it could be argued that it provides a much more useful indication of the current price trend because it is more closely aligned to the latest price movements.
As a result of this, I have always preferred to use the EMA instead of the SMA because the EMA provides up to date information, while the SMA is somewhat of a lagging indicator.
Most Popular EMA Settings
When you add the EMA to your stock or currency charts, you can obviously use whatever settings you wish.
However I would say that the best and most popular settings are 5 and 20 for the short-term trends, and 50, 100 and 200 for the medium and long-term trends.
The 5 and 20-period EMAs are arguably more suitable for traders, while the 200-period EMA is more suitable for long-term traders and investors.
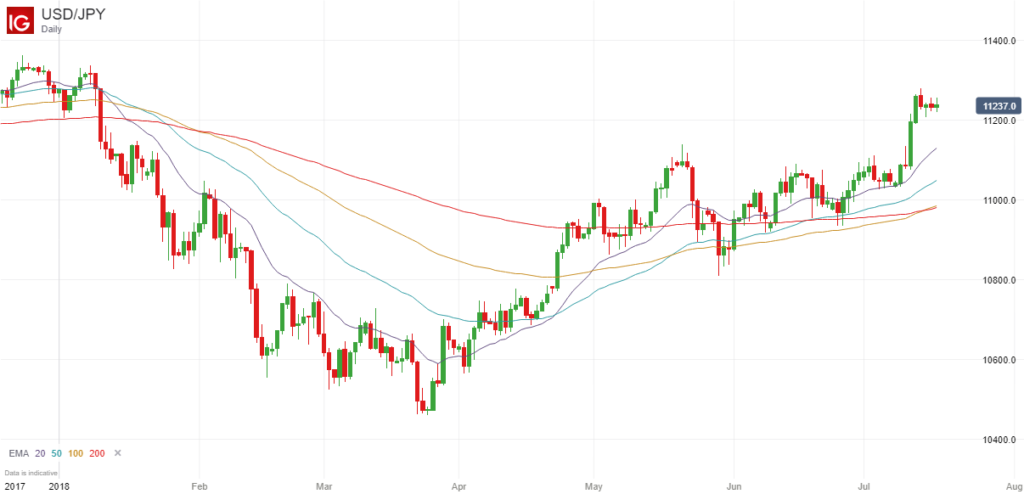
Here is a daily chart of the USD/JPY pair using 20, 50, 100 and 200-period EMAs:
Main Uses Of The Exponential Moving Average
Trend Direction Across Different Time Frames
EMAs are really good at indicating the latest trends. A 5, 10 or 20-period EMA will indicate the direction of the short-term trend, while a 100 or 200-period EMA will give you a good idea of the underlying long-term trend, as mentioned above.
Broadly speaking, the strongest trends will tend to have short, medium and long-term EMAs moving in the same direction at the same time (although the short-term EMAs will always be more volatile).
EMA Crossovers
This indicator can also be used to get you into a profitable trade because when a short-term EMA crosses through a longer-term EMA, it is a good indication of a change in trend, and is therefore a good time to enter a new position.
I myself have always found it profitable to enter long or short positions on the major forex pairs when the EMA (5) crosses the EMA (20) on the 4-hour chart, but if you like to trade stocks, for example, you might find it profitable to enter a long position when the EMA (50) crosses upwards through the EMA (100) on the daily chart, for instance.
EMA Breakouts
Another profitable way you can use the exponential moving average indicator is to use a combination of different settings, such as 5, 20, 50 and 100, for example, wait until they are all closely bunched together, and then trade the subsequent breakout.
The EMA (5) will move upwards or downwards first, followed by the EMA (20), and once a new breakout starts to take shape, you will find that you can often make some big gains if you enter a position fairly early.
Exit Point
It is not always easy to determine where you should take profits, but an exponential moving average can provide you with a natural exit point, particularly the EMA (100) and EMA (200).
This is because when you enter a trade against the trend, anticipating a reversal, the price will often be a long way above or below the EMA (200) at that point, but will inevitably move towards this EMA at some point in the future, where you can then take profits.
It doesn’t really make sense to continue holding a position beyond this point because these long-term EMAs will often act as support or resistance.
Final Thoughts
The exponential moving average is one of those indicators that everyone can potentially benefit from. As you can see from the list of benefits above, it doesn’t just indicate the latest trend, it can also get you into some very profitable trades as well if you use multiple settings.
You don’t necessarily need to know how the EMA is calculated. You just need to know that this particular moving average is superior to the simple moving average (SMA) because it places more importance on the latest prices, and should, therefore, be a lot more useful when trading stocks, forex pairs or any other markets.

looking for EMA 5 AND 21 CROSSOVER indicator