Introduction
The VWAP indicator, short for Volume Weighted Average Price, has become one of the most popular indicators amongst day traders because it basically tells you the average price that an instrument has traded at throughout the day based on price and volume.
Volume is the key determinant here because the VWAP places great emphasis on the volume that was traded at each interval, and will continually be recalculated accordingly as the day progresses.
It is most commonly used by stock traders because volume is a key driver of share prices, but I know many forex traders who also like to use VWAP as part of their trading toolkit, despite the fact that volume figures in currency trading are not always the same across all brokers.
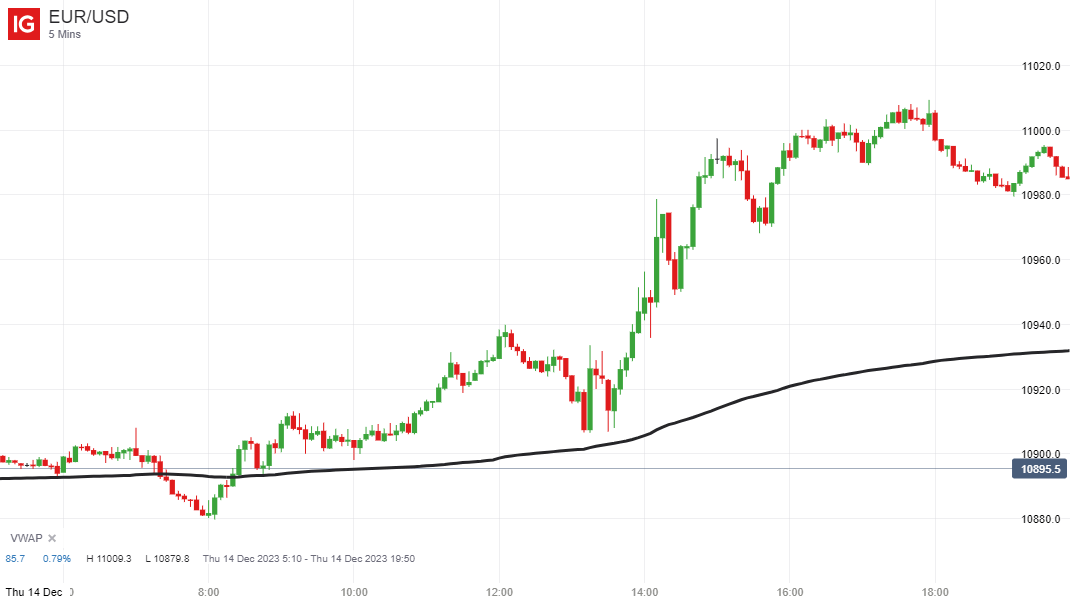
Here is an example of the VWAP indicator applied to the 5-minute chart of the EUR/USD pair:
Which Timeframes Does the VWAP Indicator Work Best on?
As the name suggests, this indicator gives you the volume weighted average price at any given time of the day (starting from the first bar/candle of the day). For that reason, it is primarily used on shorter time intervals (from the 4-hour chart down to the 1 minute chart).
Longer term traders can still use the VWAP indicator by anchoring it to a specific high or low, or a specific date on the higher time frames, and calculating the volume weighted average price from that point onwards, but this is referred to as an anchored VWAP, and will be discussed in a separate article.
In this article I just want to specifically focus on the standard VWAP indicator.
How is the VWAP Calculated?
If you add this indicator to your chart, you will never need to know how it is calculated, but it is actually very simple.
The formula is as follows:
VWAP = (Cumulative (Price x Volume) / (Cumulative Volume)
(where price = high + low + close / 3)
What is the Difference Between VWAP and Moving Averages?
Moving averages calculate the average price based purely on previous price action whereas the VWAP gives a much more accurate representation of the true trading history of retail and institutional traders because it is based on both price and the volume traded at each interval.
It is not necessarily a case of either or because both have their merits, which is why I use the VWAP alongside the 10, 20, 50 and 200-period exponential moving averages.
How to Use the VWAP
Many people use the VWAP to indicate the current trend. If the price is above the VWAP and moving higher, it is trading higher than the average volume weighted price for the day and is therefore in an upward trend, and if is below the VWAP, it is in a downward trend.
If the price is a long way above the VWAP, for example, then mean reversion traders will also take this to be a signal that an instrument is overbought, and will therefore look to open a short position and trade a reversal back towards the VWAP indicator.
Crossovers are also fairly strong signals when using the VWAP. If the price crosses upwards through the VWAP, this indicates that a market is turning bullish and possibly about to continue moving higher. The opposite is true if the price drops below the VWAP indicator.
If you study price action around the VWAP, you will see that after a strong trend and a subsequent reversal, the price will often find support and bounce off the VWAP indicator (or near the indicator) in a bullish market, and run into resistance at or near the VWAP and head lower in a bearish market. Therefore they will often give strong reversal signals.
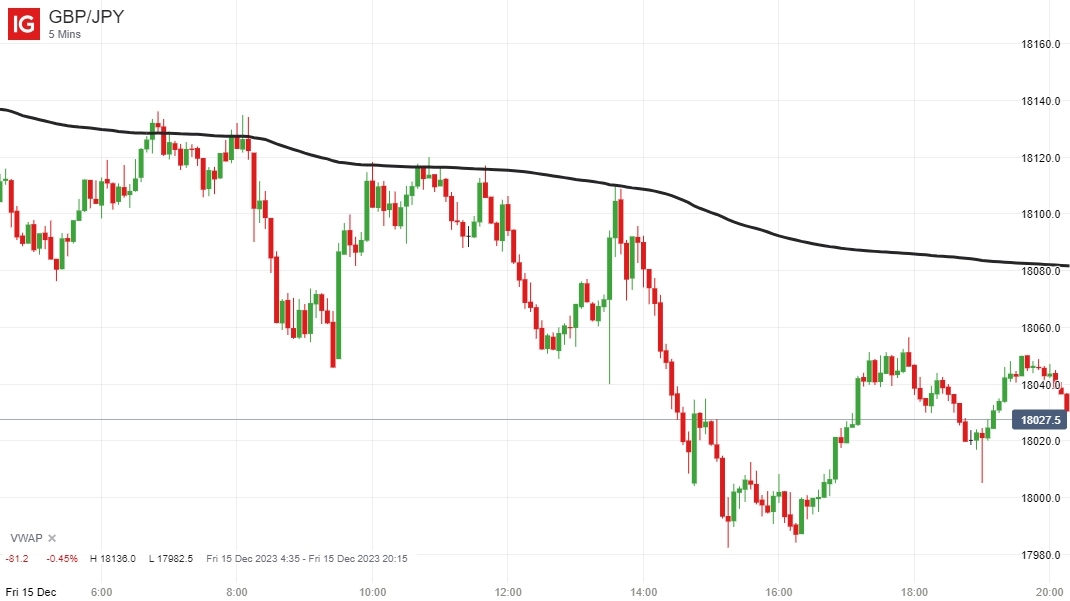
In this 5-minute chart of the GBP/JPY pair from 15 December 2023, you can see that the price moved up and touched the VWAP indicator on six separate occasions, and each time it acted as resistance and was met with a lot of selling pressure, which shows how widely respected this indicator is:
Where to Find the VWAP Indicator
While it may not be as commonly used as certain other indicators, such as MACD and RSI, for example, you should still be able to find this indicator on most of the major charting platforms.
For example, I know for certain that both TradingView and ProRealTime provide this indicator because I have used it myself on both of these platforms.
Final Thoughts
Using the VWAP in isolation is not necessarily going to make you a wildly profitable stock or forex trader, but it can still improve your overall win rate, and does work very well when used alongside a few other indicators, such as moving averages, for instance.
Some people would argue that it is more effective when day trading stocks, but I include it on all of my forex charts because it still tends to work quite well on currency pairs.
A bullish VWAP crossover and a break above the 10 and 20-period EMA is an example of a good high-probability set-up, particularly when trading in the same direction as the longer term trend.
A bounce off VWAP also tends to work well on many of the major currency pairs, and if the bounce fails, you always have the option of taking a small loss and opening a short trade on any subsequent break below VWAP.
So the point is that there are many different ways that you can use the VWAP indicator, and therefore if you do any kind of lower timeframe day trading at all, you should definitely consider adding it to your charts.

Leave a Reply