Introduction
As we enter a new month, we can see that the USD/JPY recorded another strong month in September. The price closed the month out at 1.4934, just 66 points off the key round number of 1.5000.
Subsequently, this was the 5th month out of the last 6 that this pair finished higher, which just underlines how strong this particular forex pair has been.
At the start of this 6-month period, the USD/JPY was trading at around 1.33, so the dollar has strengthened against the yen by over 12% during this time.
Where Does the USD/JPY Go From Here?
Many swing traders will now be asking themselves where the USD/JPY goes from here?
Does it break through the 1.50 level and continue heading higher, or is it more likely to fall back down?
As always, nobody knows for sure. We can only make educated predictions based on fundamental and technical analysis.
On a technical basis, it is obvious that 1.50 is likely to act as a strong resistance level in the near term.
A new high of 1.4971 was achieved on Wednesday, and many traders will be looking to see how the price reacts if it gets close to 1.50 once again this week or later this month.
Oscillating Indicators Point to a Possible Pullback
With such a sustained price rise, it is natural to assume that the traditional oscillating indicators that indicate whether a particular currency pair is overbought or oversold will show that the USD/JPY is overbought, and that’s exactly right in this case.
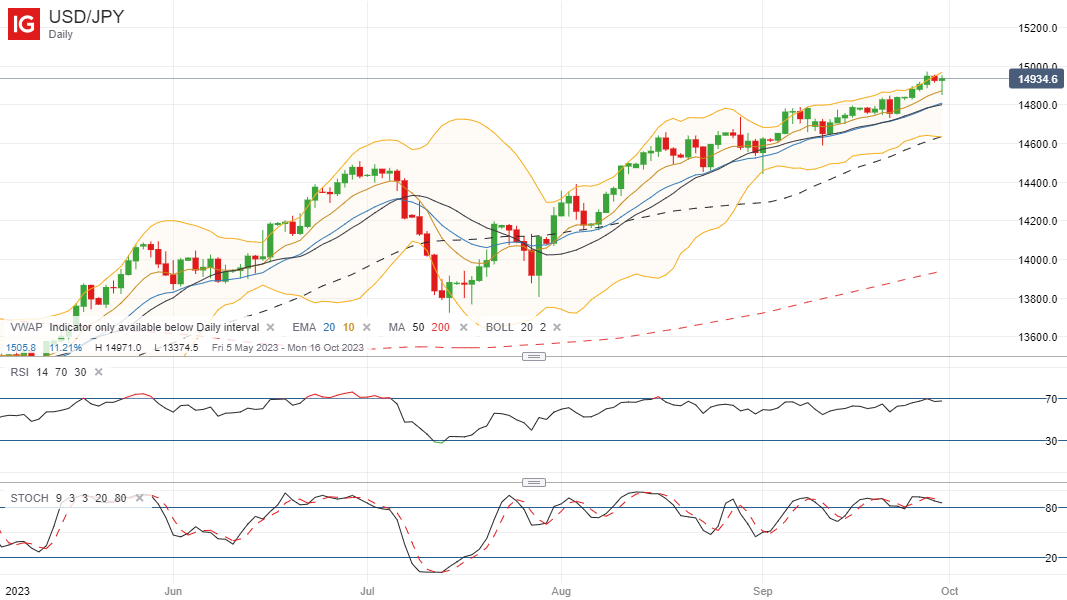
As you can see from the daily chart below, the RSI is very close to the 70 line and the stochastics indicator is well over above the overbought level of 80, suggesting that the USD/JPY is potentially overbought up here.
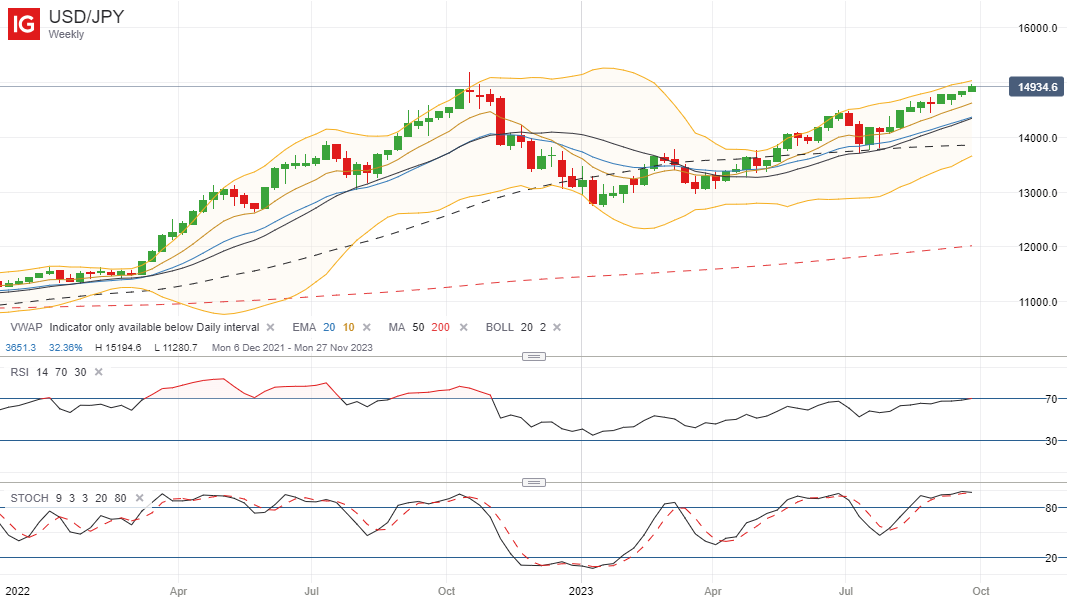
The weekly chart is even more emphatic because the RSI has just crossed above the 70 level on this timeframe, and the stochastic indicator is also well above the 80 level here as well.
Of course these are no guarantees that the USD/JPY will reverse. In fact it is extremely dangerous to take big positions based on RSI and stochastics indicators being overbought or oversold.
However they do form part of the overall picture, and when you consider that the price is trading close to the upper Bollinger bands in both of these timeframes, the odds do slightly favour a near term reversal at least.
No Key Levels if the Price Breaks Above 1.50
One problem that you have when a pair is hitting new highs is that you have no previous levels to work from if the price is making a new all-time high, or have to use very old levels from months or years ago in many cases, as is the case here.
The USD/JPY last traded over the key 1.50 level back in October 2022 for a very short period, and didn’t actually close above it, so you can’t even draw a level of resistance from the closing price. All you have is the monthly high of 1.5194 to work with.
So if the oscillating indicators are wrong and the price continues to make new highs above 1.50, it is running into clear air on the chart and could have a strong move up to 1.53, 1.54 or 1.55 in the coming months as there are no sellers above from previous levels, and the dollar is fundamentally strong thanks to the potential of one or two additional interest rate rises.
Final Thoughts
The USD/JPY is clearing running into a key level of 1.50 right now, and I personally think that it’s a difficult one to call because although the price looks technically overbought on both the daily and weekly chart, the fundamentals of the dollar are strong with the Fed already hinting that there may be one more interest rate rises this year.
So this is definitely a case of wait and see. Any hint of selling / profit taking could take the price down to 1.465 fairly quickly, which is around the level of the 50-day moving average, and possibly even a test of the 200-day moving average nearer to 1.40.
However if 1.50 offers little resistance and there is little selling around this level, there is definitely the potential for the price to break through 1.50 and clear the previous October 2022 high of 1.5194 because this is a fairly weak resistance level.

Leave a Reply