Why Divergence Systems Work So Well
In the world of forex trading, divergence is simply where the price of a particular currency pair is making new highs, but a relevant technical indicator is failing to make new highs (and starting to move lower), or where a forex pair is making new lows, but a technical indicator is failing to make new lows (and starting to move higher).
The significance of this is that it basically signals that the existing trend is running out of momentum, and there is likely to be a price reversal that you could potentially profit from.
The CCI Divergence System
You can use many different indicators to trade these divergence patterns, such as RSI and Stochastics, for example, but in this article I want to discuss a CCI divergence trading system that you can use to trade the major forex pairs because the CCI technical indicator is one of the most effective ones that you can use for this purpose.
If you want to, you could add a CCI indicator to your price chart and look for divergence to occur using this one indicator, but for stronger signals, it is a better idea to use two CCI indicators with different settings, and wait until divergence occurs on both indicators at the same time.
I have always found that the CCI (10) and CCI (60) tend to give good signals if they both show divergence at the same time because the price will often reverse in the opposing direction when this occurs.
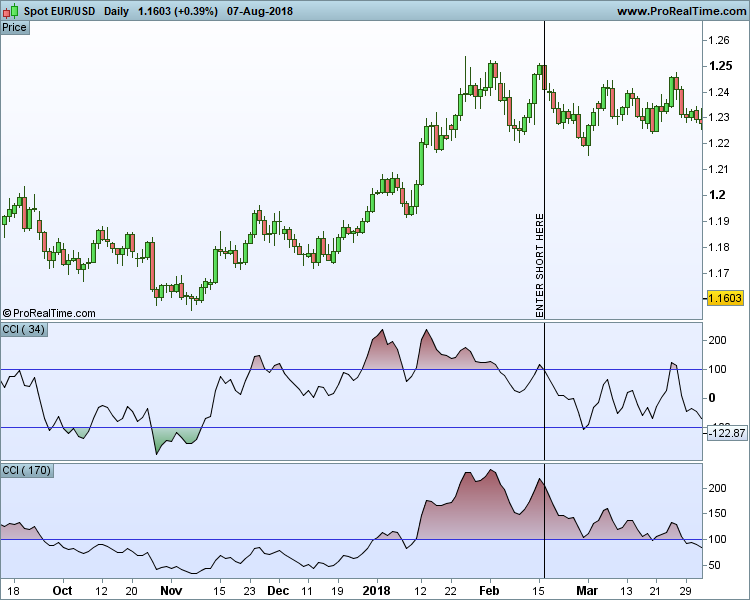
However some traders like to use different combinations, such as CCI (13) and CCI (89), for example, or CCI (34) and CCI (170), as shown in the trading example below:
Your overall success rate will largely depend on which time frame you like to trade, so it is worth experimenting with different settings.
With regards to entry points, many traders like to enter a position at the close of the following bar or candle after the divergence pattern is first seen, like in the example above, and determine their exit point based on 1 or 2 x ATR, a fibonacci retracement level such as 23.6% or a set number of points, depending on the time frame that is used.
Whichever rules are applied, it is always a good idea to use a stop loss when entering any positions, and to look to make more points from your winning trades in order to compensate for any losing trades because there are no guarantees of success even with the strongest divergence signals.
CCI Divergence Indicators For MT4 / ProRealTime
If you are having trouble seeing these divergence patterns on your price charts, you might want to consider using one of the CCI divergence indicators that are available for some of the charting platforms.
I have already discovered that there is a CCI divergence indicator on ProRealTime that is really easy to use because it shows a green bar when there is positive divergence, a red bar when there is bearish divergence and no bars when there is no divergence at all.
So obviously when you get two green bars or two red bars on two different CCI indicators at the same time, this is clearly a very strong signal, and is very easy to see, as you can see below:
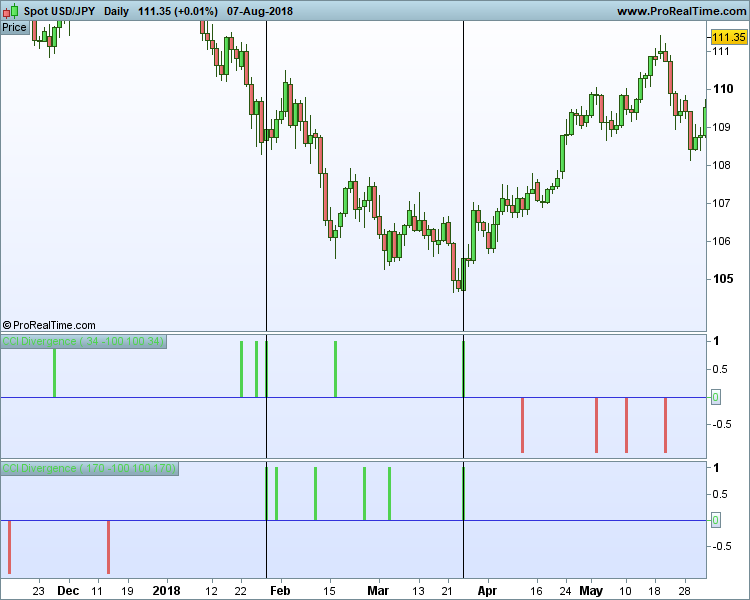
The two lines indicate where there is bullish divergence on both the CCI (34) and CCI (170), and therefore where to enter a long position, and as you can see, both of these set-ups would have been profitable, albeit to differing degrees.
If you don’t have access to the ProRealTime platform, I understand that there is another CCI divergence indicator on the MT4 platform that you can use (the download link can be found on this page), although I haven’t actually used this one myself yet.
So there are options if you don’t want to be staring at your charts all the time trying to spot these divergence patterns yourself.
Alternative CCI Divergence Trading Strategies
I have already discussed one strategy that attempts to trade price reversals when there is clear divergence on two separate CCI indicators, but there are other ways you can trade these divergence patterns.
For example, you can use the longer term CCI indicator to indicate the current trend (above 0 = bullish trend, below 0 = bearish trend), and then wait for opportunities to trade with this trend by waiting for divergence to occur on the shorter-term CCI indicator.
So if the CCI (60) is above 0, this indicates a bullish trend. Therefore you would want to wait for the price to fall back and for a bullish divergence pattern to emerge on the CCI (10), for example, before entering a long position.
Finally, instead of using two CCI indicators with different settings, you might like to try using the CCI indicator in combination with the RSI indicator because these indicators will also give very strong signals if there is divergence on both of them at the same time.

Leave a Reply