The Basic RSI Indicator
The RSI indicator is one of the most popular technical indicators amongst traders and investors because it basically tells you when a particular market is overbought or oversold.
Oscillating between 0 and 100, a market is said to be overbought when the RSI is above 70 and oversold when it is below 30, however some traders prefer to use 80 and 20 instead.
Furthermore, the market is said to be bullish when it crosses above 50, and bearish when it crosses below 50.
The only slight drawback of this indicator is that the overbought and oversold levels are fixed, which is why someone decided to develop a dynamic RSI indicator that has dynamic levels that respond to market conditions, in an attempt to provide even better signals.
How to Use the Dynamic Zone RSI Indicator
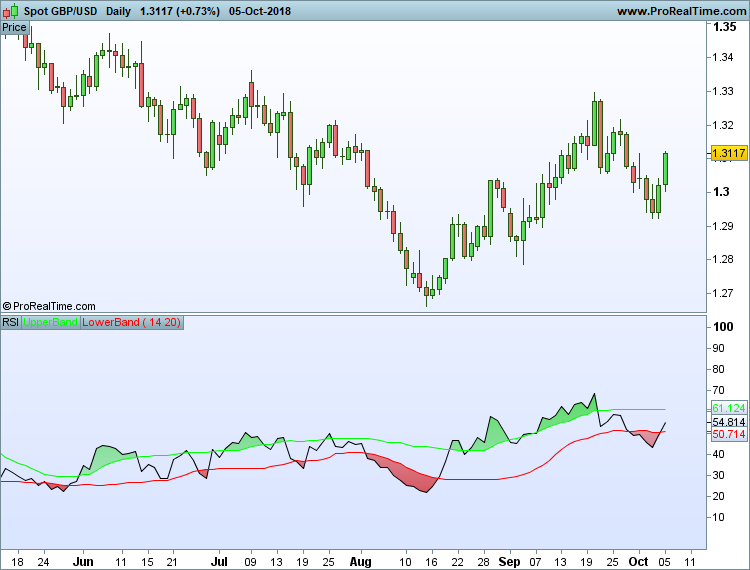
The dynamic zone RSI indicator may look fairly complicated at first glance because it has two additional lines (green and red), as well as green and red shaded areas, but it is actually fairly easy to use.
The black line on the chart is the standard RSI indicator, the green line is the upper limit and the red line is the lower limit.
A market is said to be overbought when the RSI is above the green upper limit, indicated by the green shaded area, and oversold when the RSI is below the red lower limit, indicated by the red shaded area.
Therefore traders can choose to either enter short positions in the green dynamic zone or long positions in the red dynamic zone, but clearer signals are provided when the RSI indicator crosses below the upper limit if looking to go short, or crosses above the lower limit if looking to go long.
It is important to note that a market can still be overbought even if the RSI is below 70 if there is a green dynamic zone on the chart, and vice versa if there is a red dynamic zone. Indeed the RSI reading is largely irrelevant when using the dynamic zone RSI indicator because you are just looking out for green and red zones.
Best Settings to Use for the Dynamic Zone RSI
The standard settings for the dynamic zone RSI indicator are 14 and 20, where 14 is the RSI number of periods and 20 is the moving average number of periods.
However you can of course adjust these settings to suit your own particular strategy. Most traders tend to stick with the standard settings, but I know a few traders who think that 5 and 20 is the best setting to use for this particular indicator.
Limitations
All indicators have their limitations and this one is no exception. You will find that this indicator does indeed respond to market conditions to give you clear overbought and oversold zones, and gives fairly good signals when the RSI crosses below the upper limit or above the upper limit, but the major problem is that you still get a fair share of false crossovers.
For example, even when you have a green dynamic zone and the RSI crosses below the upper limit to give you a signal to go short, the price can still continue heading higher if it is in a really strong upward trend.
Therefore it is fair to say that I am not really a big fan of this dynamic zone RSI indicator, and I certainly wouldn’t use it in isolation.
If I were to use this indicator, I would probably combine it with one or two other technical indicators, such as the MACD histogram, for example, to look for divergence because this would give stronger and more reliable reversal signals, but trading price action and looking for trendline breaks and reversal candlesticks can be just as profitable in my experience.
Where to Find This Indicator
This advanced version of the RSI indicator is nowhere near as common as the basic RSI indicator, but you can find it on ProRealTime, and I understand that you can also download it to the MT4 platform as well if you would like to test it out for yourself.

Hello. I am interested in this rsi indicator for mt4.
Regards