Introduction
The Supertrend indicator is one of the most effective indicators for indicating trends, and it is really to use because it is either green, indicating a bullish trend, or red, indicating a bearish trend.
Therefore you can tell in an instant if a particular forex pair or market is trending upwards or downwards on any given time frame, and you can also use it to signal a change in trend when it changes from green to red, or vice versa.
I have been using this indicator for many years now, but have recently been playing around with it to come up with a long-term trading strategy that you can use on the weekly charts.
This strategy will probably work better on stocks because these will often trend upwards or downwards for long periods of time, but it may also work well on forex pairs as well.
Indicators / Settings
The Supertrend indicator is the cornerstone of this strategy, and with this particular strategy you need to add four Supertrend indicators with different settings, which are as follows:
- Supertrend (3, 3)
- Supertrend (3, 10)
- Supertrend (3, 40)
- Supertrend (3, 160)
The first number is the multiplier, which should remain constant, and the second number is the number of periods, or weeks in this case.
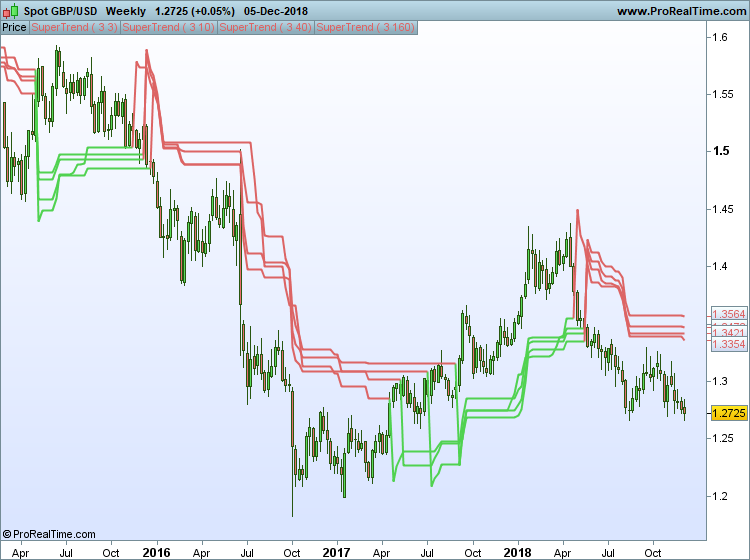
Your chart should then look something like this:
Entry Signals
I am still experimenting with this strategy, but you basically want to go long when all four indicators are green, and go short when all four indicators are red, entering a trade when the last of these indicators changes color.
You can either enter at the close of the weekly trigger candle, or wait for a pull-back before entering a position because these pull-backs seem to occur regularly when you get a big change in trend.
Exit Points
Exit points are a lot harder to pinpoint. One obvious strategy is to wait for all four Supertrend indicators to change color, but the drawback of this is that there may be occasions when you give back a lot of your profits.
So an alternative strategy is to wait for just one Supertrend indicator to change color before closing a position, or close half at this point and close the other half when the long-term Supertrend, ie the 160-period Supertrend, finally changes color.
Real Life Example
If you take a look at the weekly chart of the GBP/USD pair above, you can see that the last three set-ups would have been very profitable to trade if you closed the position when one of the Supertrend indicators changed color each time.
Trade 1 – short at 1.4782, exit position at 1.2951, profit = 1831 points
Trade 2 – long at 1.3196, exit position at 1.3534, profit = 338 points
Trade 3 – short at 1.3302, today’s price = 1.2783, profit to date = 519 points
Closing Comments
This strategy is still very much a work in progress, so I welcome any comments or suggestions that you may have (leave your comments below).
The downside of this strategy is that there may be occasions when you get false breakouts, and if you exit a trade when one of the Supertrend indicators changes colors, your losing trades could be quite large when you get one of these false breakouts.
However the upside is that you could potentially make thousands of pips profit, particularly on the weekly time frame, because the trends can be long and sustained after all four indicators turn green or red.
So I think that this long-term Supertrend strategy does have some potential when it is used to trade various different markets.

I am a forex trader, have you perfected this as you said you were experimenting
I am currently running this strategy on 30M chart on the FTSE and the timing and results are very interesting.
More disturbing is/are the Monthly, Weekly views of this index through such a lens.
If this prognosis works out as per the ‘multiple Supertrend tea leaves’, then the FTSE futures will not pay for many holidays or pensions
Hi,
Very insightful post…
Just 2 questions,
have you tested this on individual stocks as well?
If yes, does this work better with more liquid stocks or is it equally effective on illiquid stocks?
Currently experimenting with Ehler’s Super Smoother (2, 20) which I like much better than Supertrend … but I am trying a long term Supertrend with it, like maybe 3, 55 or 3, 144 or something, as an alternative to a long term EMA
So I think there’s potential for Ehler Super Smoother as a short term MA n Supertrend as a long term MA
Thanks for your comment Steve. I will take a look at that indicator if I can find it.