Why Traders Fail To Make Money Using Price Charts
If you were to ask the average trader why they use price charts when trading the forex markets, they will inevitably tell you that it helps them predict future price movements.
However if you look at the trading records of most forex traders, you will see that the vast majority lose money. So where are they going wrong?
Well there is a right way and a wrong way to use charts.
Technical indicators can be absolutely invaluable, particularly when several indicators are in alignment with each other, and indicate that the market is likely to move in a certain direction in the near future.
However many people go wrong because they enter trading positions at certain price points that have no real significance.
For example, you may think that you have found a promising reversal signal based on several key indicators, but if it is not close to a major support or resistance level, then the odds of success are greatly reduced.
Here Is The Solution…
The best way to use charts when trading forex is to try to enter positions in accordance with the key market players (banks, financial institutions, etc) because these are the people that really move the markets.
Therefore you need to enter at key support and resistance levels, and to help you do this, there are some important tools that you need to use. These include:
- Trendlines
- Pivot points
- Fibonacci levels
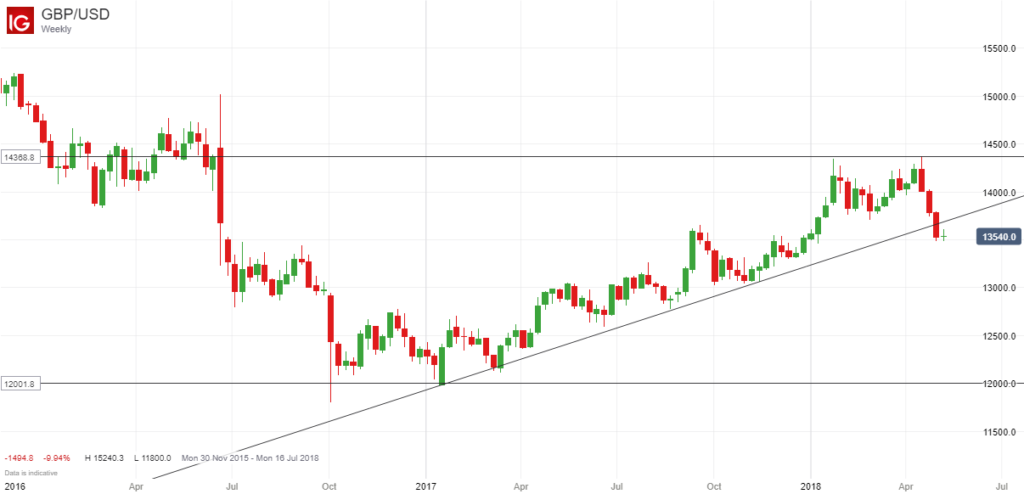
- Round numbers (if they have proved significant in the past), eg 1.2000 for the GBP/USD
- Most widely used technical indicators, eg the 200-day moving average
Once you have plotted all of these areas of support and resistance on your price charts, you will start to see that the price will often react in a predictable manner around these key levels.
Furthermore, when you have several of these indicators marking out key support and resistance levels, your odds of success are increased even further because there is a greater chance that the market will reverse when it hits one of these levels.
Final Thoughts
The key to successful forex trading is to put the odds firmly in your favour every time you enter a trade.
So by plotting some key support and resistance levels on your charts using as many of these tools as possible, you will increase your chances of success because you will be trading with the big boys rather than against them.
I have to admit that this is something that I haven’t always done myself, but if you check out the most successful traders on the various forex forums or forex signal sites such as ZuluTrade, for example, you will see that many of them tend to use key support and resistance levels as their cue to enter the markets.
The key point I want to get across is that if you are still struggling to make money from the forex markets, this is something you should seriously consider doing in the future because it is widely regarded as the most profitable way to trade, and one of the most effective ways to use price charts.

Leave a Reply