Introduction to the RSI and Stochastic Indicators
There are quite a few oscillating indicators that you can use to indicate when a particular currency pair is overbought (and therefore likely to fall) or oversold (and therefore likely to rise).
However the RSI and stochastic indicators are two in particular that have always been very popular with both traders and investors.
These indicators oscillate between 0 and 100 as the price of the underlying instrument rises and falls, but a market is said to be overbought when the RSI indicator is above 70 and oversold when it falls below 30.
Similarly, if you are using the stochastic indicator, it is said to be overbought when the indicator is above 80, and oversold when it is below 20.
The Limitations of These Indicators
I am a big fan of these indicators when investing in stocks because if you focus on finding large cap stocks that are consistently growing their earnings and dividends every year, and are trading on quite a low earnings multiple (as indicated by the P/E ratio), you can get real value when you wait for both of these indicators to enter oversold territory below 30 or 20.
When you are trading currency pairs, however, they are far less reliable, in my experience.
That’s because both of these indicators will often enter overbought territory, suggesting that the price of a currency pair might have peaked, but remain in overbought territory for quite a long time as the price continues to move higher and higher.
The same thing can happen when you think a currency pair has bottomed out based on the readings of these two indicators.
This is true regardless of whether you are trading the 5 minute charts, for example, or whether you are looking at the daily or weekly price charts, for instance.
To demonstrate this point, you only need to look at the daily price chart of the GBP/USD in 2018:
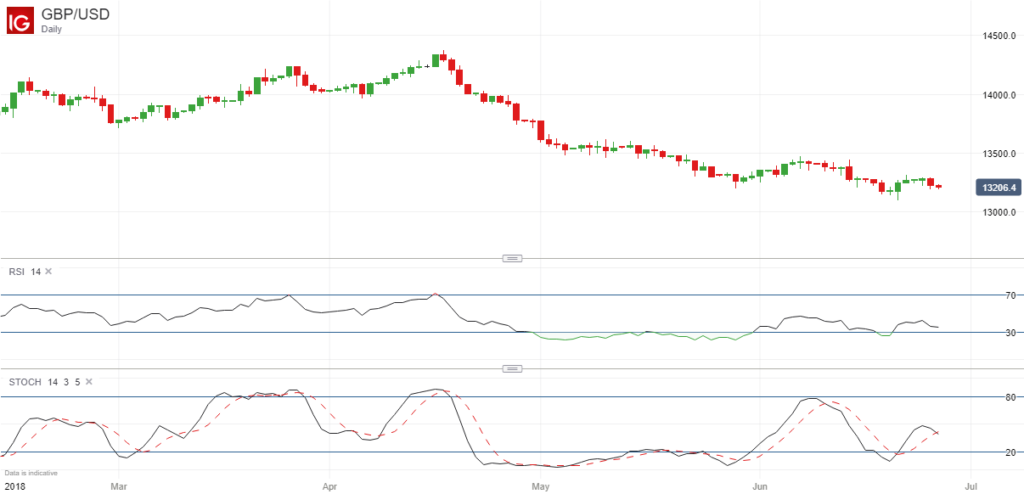
As you can see, the RSI and stochastics were both in oversold territory at the start of May 2018, but remained in oversold territory for the rest of the month.
So if you had entered a long position at around 1.3600 expecting a reversal, you would have been left badly out of pocket because the price subsequently fell another 400 points, and is still trading around the same level today.
Therefore, although you can sometimes make some decent profits calling the top or the bottom of a trend using both of these indicators, you can also lose a lot of money if you are not careful because the price doesn’t always reverse straight away when these indicators are in overbought or oversold territory, and sometimes there is no substantial reversal at all.
Possible Solutions
If you do still wish to trade these price reversals when trading the various forex pairs, there are two possible solutions that may improve your overall success rate:
- Look for divergence patterns
Instead of simply going long when the RSI is below 30 and the stochastic indicator is below 20, it is often a lot more profitable to wait for a divergence pattern to emerge because this will indicate that the previous trend is running out of momentum.
There are no guarantees of course, but if the price of the currency pair is making new lows, for example, but the RSI and stochastics are oversold and making higher lows, this is often a good time to enter a long position.
- Use a few other indicators
As well as using these two oscillating indicators to indicate when a pair is oversold and overbought, you may also find it beneficial to add a few other indicators to your price charts for additional confirmation that a reversal is highly likely to occur.
The MACD indicator is one of the most effective ones to use because you can look for MACD crossovers on the indicator itself, and can also look for divergence on the MACD histogram.
However there are many other indicators that you can use, as you will discover if you trawl through Tradingview and some of the leading chart providers.
For example, I recently discovered that the STARC bands indicator was available on MT4 and MT5 and found that this is also quite effective at highlighting when markets are seriously overbought or oversold and likely to reverse.
Final Thoughts
The point is that if you are consistently trying to trade the peaks and troughs of the major currency pairs using these indicators alone, I would say that you are unlikely to make money in the long run.
It is much better to look for divergence patterns to emerge on the RSI and/or stochastic indicators, and use a few other indicators for guidance.
These price reversals can be very profitable if you call them correctly, but if you still find that you are unable to earn consistent returns trading these reversals, you may find it more profitable to switch to breakout trading or momentum trading instead.

Leave a Reply