Introduction
The imaginatively named ROC n ROLL technical indicator is not necessarily one that you will find on every single charting platform, but if you have access to ProRealTime (or use a broker that uses the ProRealTime charting software), you may want to consider adding it to your charts.
That’s because it is really easy to use, and provides you with some useful information regarding the current market trends.
It is based on a Rate of Change, hence the ROC part of the name, and exponential moving averages of different periods, and taking the form of a histogram, it basically tells you if a market is bullish, bearish or not trending at all.
Green = bullish upward trend
Red = bearish downward trend
Blue = no clear trend
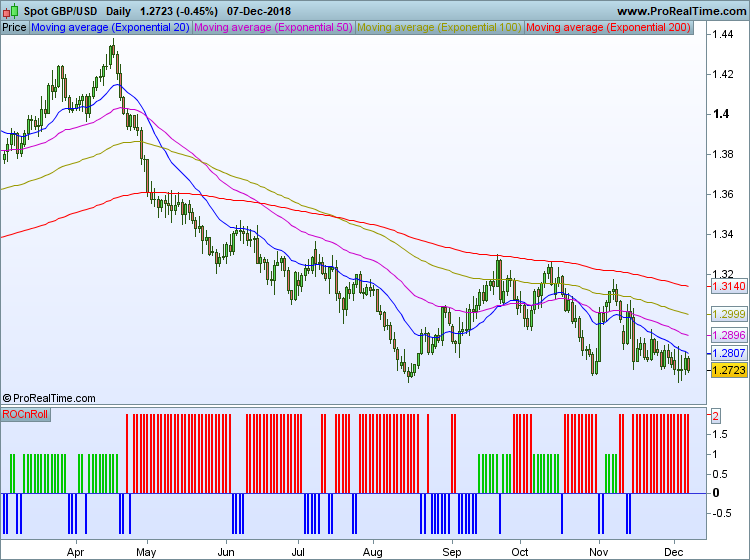
You can see from the daily chart of the GBP/USD chart above that it gives clear and accurate signals because apart from a few mini rallies, it has barely turned green throughout the current downward trend.
How To Use
In simple terms, you should consider opening long positions when the ROC n ROLL indicator is green, and consider opening short positions when the ROC n ROLL indicator is red in order to trade in the same direction as the current market trend.
If it turns blue, you should stay out of the market until a clear trend is established, ie when you start to get a series of consecutive green or red histograms.
Advanced Uses
It is also a good idea to apply this indicator to multiple time frames in order to get a clearer picture of the overall trend, and to get into a position at the most opportune moments on the shorter time frames.
For example, if the ROC n ROLL indicator is currently green on the daily and 4-hour chart, indicating a bullish trend, but red on the 1-hour chart after a brief pull-back, it might be a profitable strategy to open long positions when the histogram turns from red to green or from blue to green on this lower time frame.
If you had adopted a similar strategy when trading the GBP/USD pair this year, you would have done really well because the ROC n ROLL histogram has remained red (or blue) on the weekly chart since it initially turned downwards back in May, and has never once turned green.
Therefore if you had opened short positions whenever the ROC n ROLL turned red on the daily chart, you would have captured a lot of the big price moves, as shown in the chart above.
Final Thoughts
I’m not going to say that the ROC n ROLL indicator is the magic indicator that you have been looking for all your life because there is no indicator that will give you profitable signals 100% of the time.
However if you are looking to simply increase your overall win ratio, you might want to consider adding this simple indicator to your charts because if you only ever trade long when the ROC n ROLL indicator is green and only trade short when it is red, you won’t go far wrong, particularly if you apply it to multiple time frames, as described above.

where can i download it?
It’s available on the ProRealTime platform, or any broker who uses this platform.